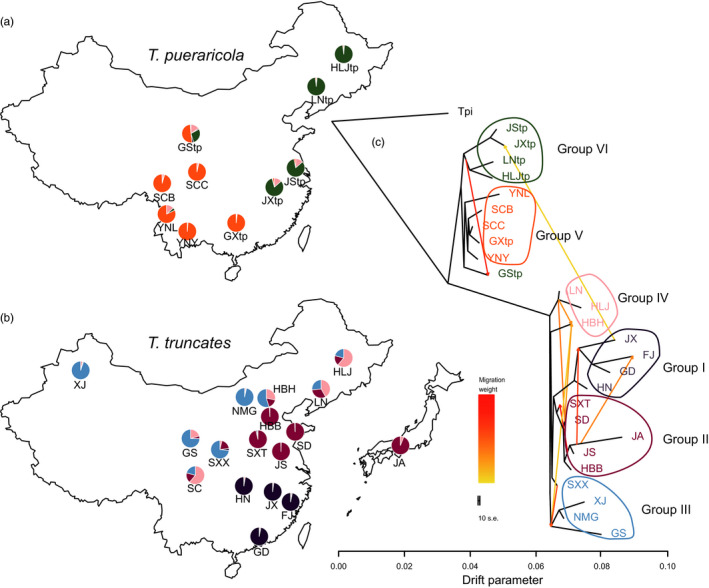
FIGURE 2.

Maps and admixture events of the spider mites. Geographic locations of 27 populations for T. pueraricola (a) and T. truncatus (b) with ancestral proportions (K = 6) inferred from ADMIXTURE. (c) The relationships among populations of these two dominated spider mites. Each population is colored according to its corresponding group, and each arrow indicates a migration event which is colored with migration weights. The scale bar shows 10× the average standard error of the entries in the sample covariance matrix
