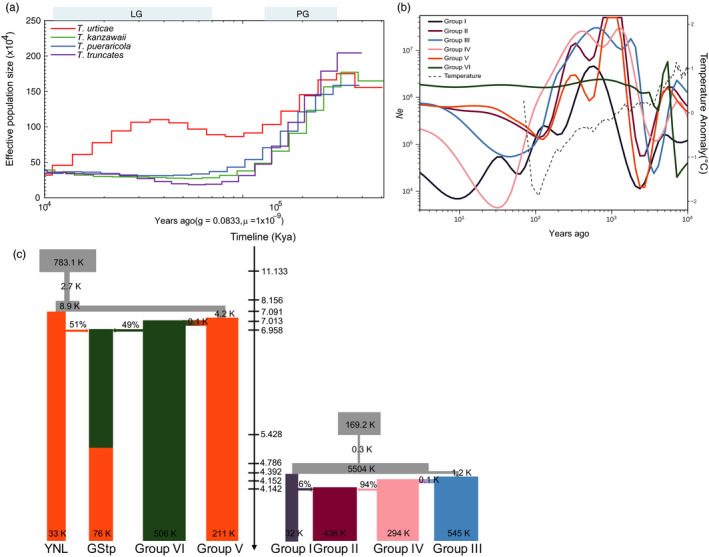
FIGURE 3.

Demographic history of the spider mites. (a) PSMC analysis performed on the representatives of each species sequenced at high coverage to indicate variation in N e over the last 105 years. LG and PG represent period of last glaciation and penultimate glaciation separately. (b) Demographic changes of N e for six groups of T. truncatus and T. pueraricola in the recent 104 years using SMC++. Note that the SC population has been excluded from Group IV because of sampling uncertainty. Northern hemispheric (90‐30N) temperature anomaly from the mean temperature of AD 1962–1990. (c) The best demographic scenarios for T. truncatus and T. pueraricola inferred by fastsimcoal2. The gray rectangles represent ancestral populations, and the arrows indicate admixture events. To better understand demographic history of T. pueraricola, populations of YNL and GStp are assigned as single groups
