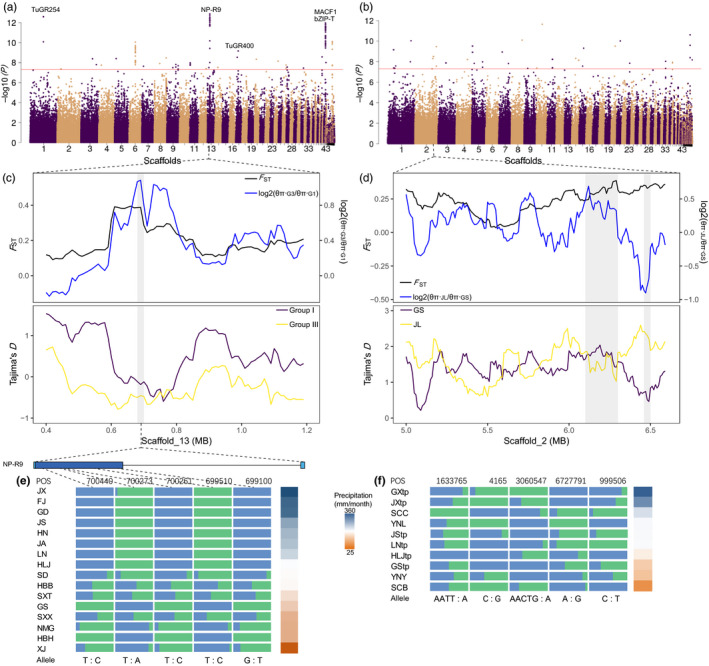
FIGURE 4.

Signatures of local adaptation in the genome of spider mites. Manhattan plots of adjusted p‐values using the LFMM for association between SNPs and precipitation in T. truncatus (a) and T. pueraricola (b). The genome‐wide significance threshold (‐log10(5e‐8)) is indicated by the red horizontal line. Those genes with non‐synonymous substitution caused by significantly associated SNPs (adjusted p‐value > 5e‐8) were marked in the Manhattan plots. (c) FST, log2(θ π ratio), and Tajima's D values around the strongest associated gene NP‐R9 of T. truncatus. G1 and G3 are the abbreviations for Group I and Group III. (d) FST, log2(θ π ratio), and Tajima's D values around significantly associated genomic regions in scaffold_2 of T. pueraricola. JL represents JStp and LNtp populations. GS represents GXtp and SCB populations. (e) Allele frequencies of five non‐synonymous mutations within the NP‐R9 gene across the populations of T. truncatus. Based on the precipitation of the wettest month, the relatively moist regions include FJ, GD, JX, and HN and the relative arid regions include XJ, NMG, GS, and HBH. (f) Allele frequencies of the five most associated SNPs with the genomic positions of scaffold_10:1633765, scaffold_230:4165, scaffold_8:3060547, scaffold_1:6727791, and scaffold_21:999506 across the populations of T. pueraricola
