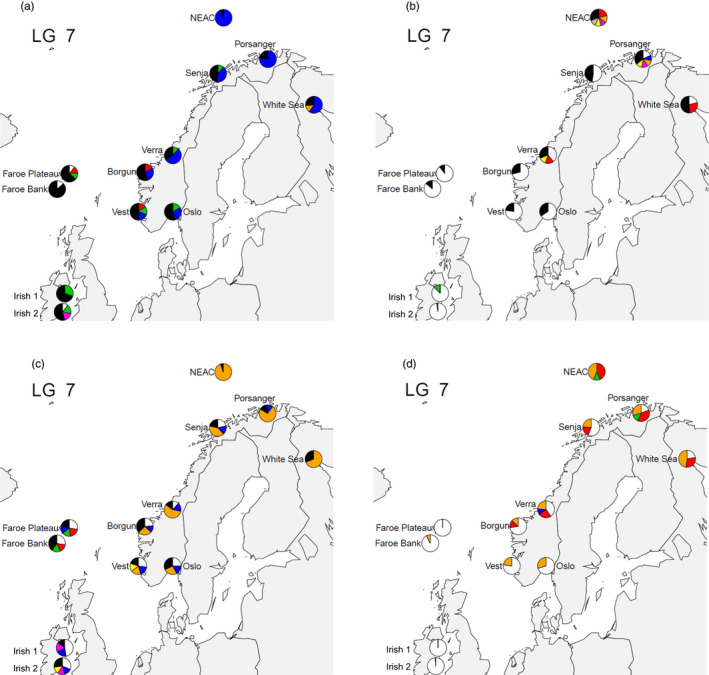
FIGURE 7.

Geographic distribution haplotypes. The four plots represent different subregions of LG7 (cf. Table 2). (a) LG7 SNP frame 205–219, (b) LG7 SNP frame 252–266, (c) LG7 SNP frame 287–301 and (d) LG7 SNP frame 330–344. Each haplotype is identified by the same given colour across sampling sites. Black represents the sum of all other haplotypes displaying < 10% frequencies
