
FIGURE 1.
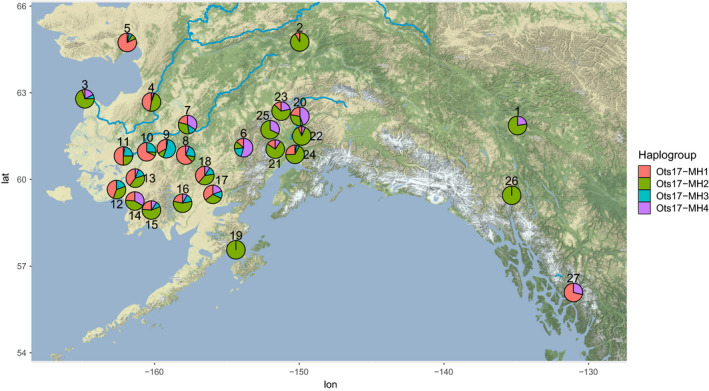
Frequency of Y‐chromosome haplogroups throughout Alaska based on RADseq and GT‐seq data. Locations of populations are approximate to prevent overlap of pie charts. Population names are given in Table 1. Note that the location for the Lower Yukon Test Fishery (population 3) indicates where fish were caught on their return to the Yukon River; these samples may represent fish from many populations that spawn throughout the Yukon River