
FIGURE 5.
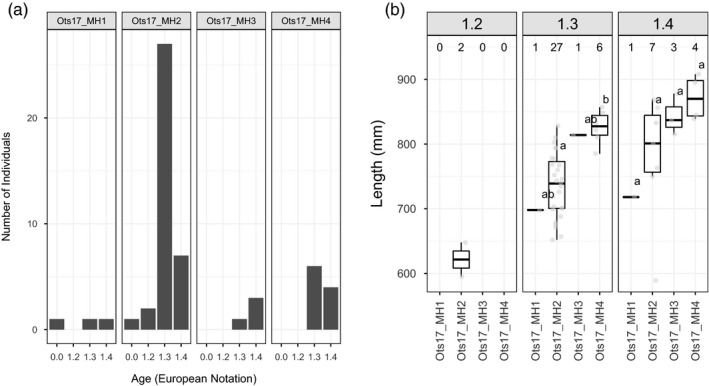
Distribution of (A) age at maturity and (B) size at age for each Y‐chromosome haplogroup in the Yukon River. Length of each individual is shown by gray points. Within each age class, Y‐chromosome haplogroups with statistically different lengths are represented by different letters. Sample sizes for each haplotype are given above the boxplots