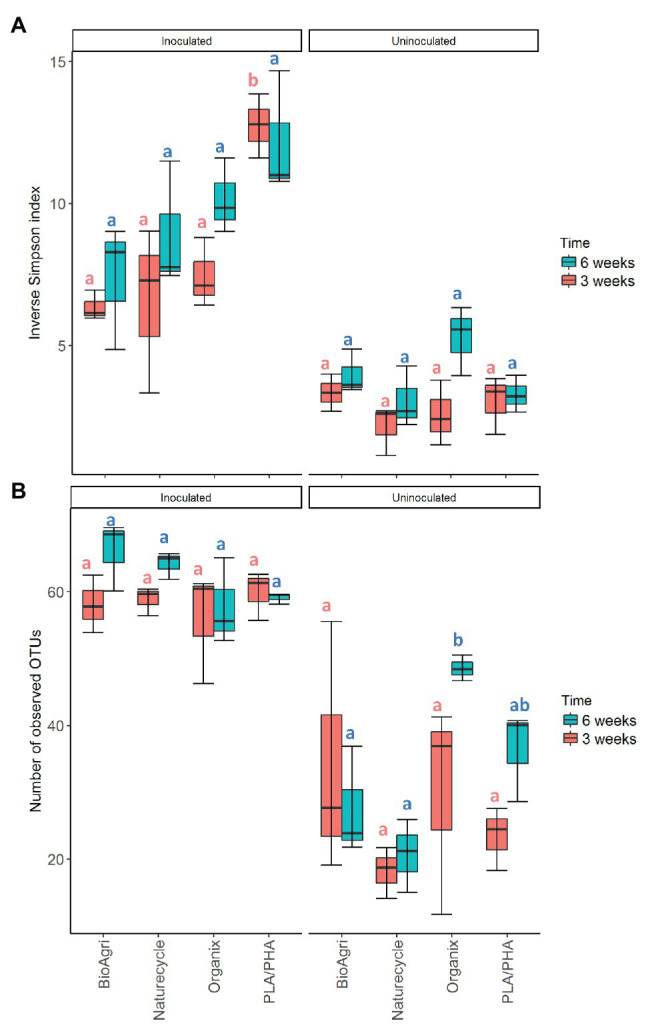
Figure 2.

(A) Diversity (inverse Simpson index) and (B) richness [number of observed operational taxonomic unit (OTU)] for bacterial communities in inoculated and uninoculated enrichments. The lower and upper hinges of the boxplots correspond to the 25th and 75th percentiles and the middle of the box denotes the median at 50th percentile. Whiskers denote 1.5 times the inter-quartile range. Letters indicate Tukey post hoc results following a one-way ANOVA. All significances tested at α = 0.05.
