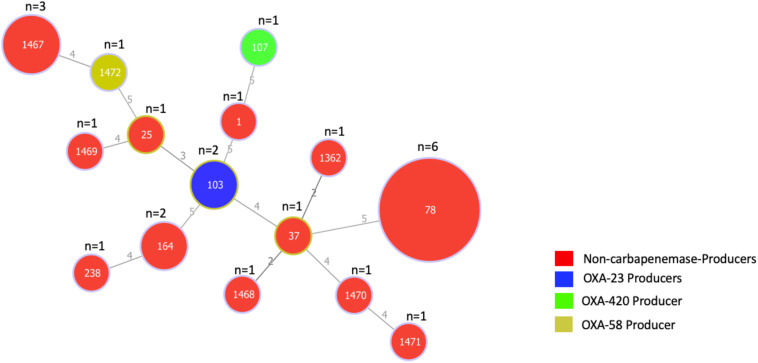
FIGURE 1.
Minimum spanning tree based on the allelic profiles of 15 STs identified in 24 A. baumannii isolates. The number of isolates for each ST is shown at the top of each node. Node sizes are proportional to the number of isolates for each ST and numbers on connecting lines indicate the number of locus variants determined by pair-wise comparisons. Colors indicate whether isolates are carbapenemase producers and if so, the type of carbapenemase they produce.

