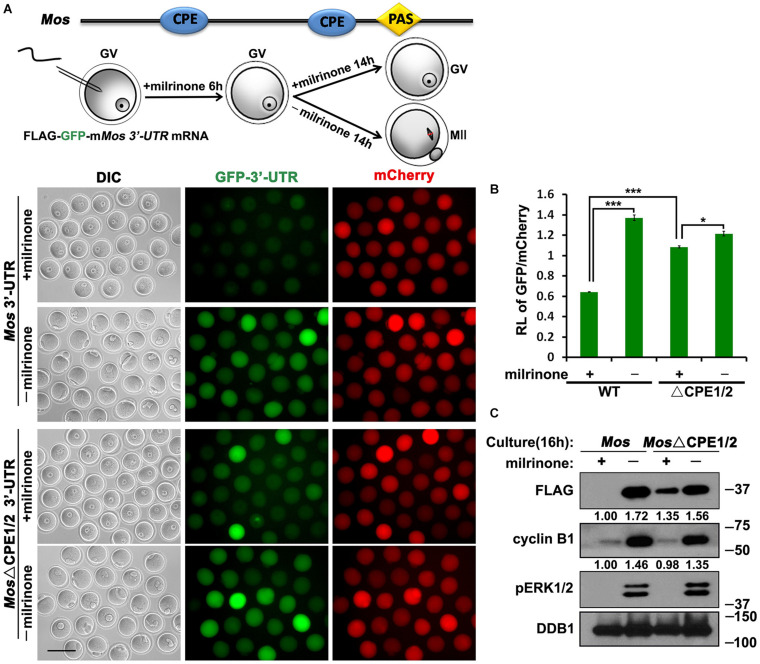
FIGURE 4.
Translational activation of Mos mRNA during meiotic maturation in mouse oocytes. (A,C) Fluorescence microscopy (A) and western blot analysis (C) results revealing the expression levels of Flag-GFP fused with Mos 3′-UTR or its CPE-mutated (ΔCPE) form. For each set of data, 70 oocytes were observed. Plotting scale: 100 μm. (B) The ratio of the GFP and mCherry fluorescence signals intensity in (A). Data were analyzed by mean ± SEM: *P < 0.05, ***P < 0.001. DDB1 was used for a control. Numbers under blot bands indicate the intensity of each band.

