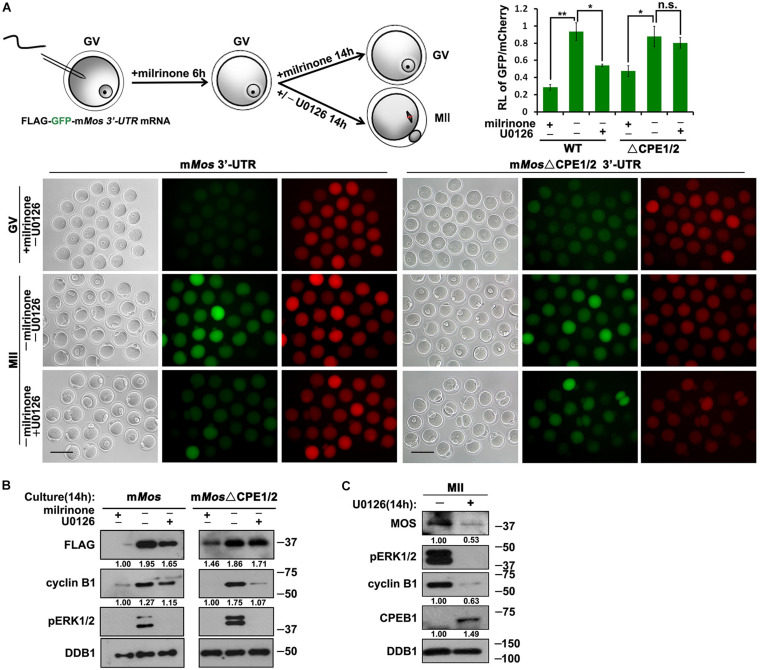
FIGURE 5.
Roles of CDK1 and ERK1/2 in the translational activation of Mos mRNA. (A) Fluorescence microscopy and the ratio of the GFP and mCherry fluorescence signals intensity results showing Flag-GFP expression driven by WT and CPE-mutated Mos 3′-UTR with different U0126 (20 μM) treatment. For each set of data, 50 oocytes were gathered. Plotting scale: 100 μm. (B) Western blot analysis results revealing translational levels of the reporter mRNA as well as endogenous cyclin B1 in (A). For each set of data, 80 oocytes were gathered and loaded. DDB1 was used for a control. Numbers under blot bands indicate the intensity of each band. (C) Western blot analysis results revealing protein levels of endogenous MOS as well as phosphorylated ERK1/2 expression in mouse MII oocytes with different U0126 (20 μM) treatment. For each set of data, 300 oocytes were gathered and loaded. DDB1 was used for a control. Numbers under blot bands indicate the intensity of each band.

