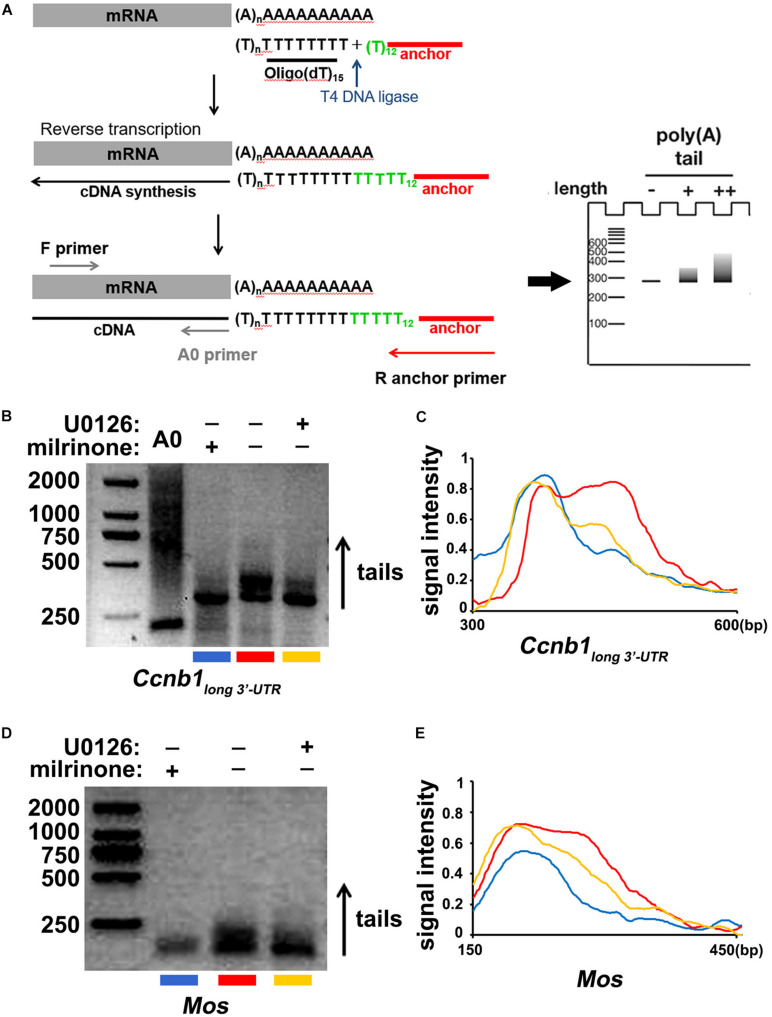
FIGURE 6.
Cytoplasmic polyadenylation of Ccnb1 and Mos transcripts. (A) A schematic representation of the poly(A) tail assay (PAT) assay. (B) Data of the PAT assay revealing the length of Ccnb1 long 3′–UTR transcripts’ poly(A) tail in oocytes with different U0126 (20 μM) treatment. Conditions of PCR amplification had detailedly described in the section “Materials and Methods.” (C) Quantitative statistics of the PAT assay results in (B). The plane coordinate representing the floating length of the PCR products from a appointed point to the x-axis, measured relative signal intensity to the y-axis. (D) Results of the PAT assay revealing the length of Mos transcripts’ poly(A) tail in oocytes with different U0126 (20 μM) treatment. (E) Quantitative statistics of results in (D).

