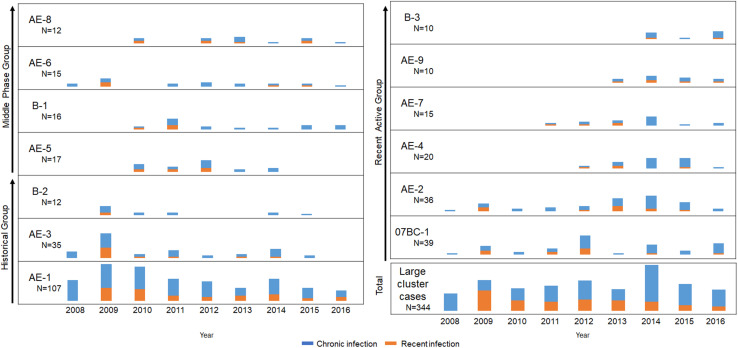
FIGURE 3.
Expanding dynamics of the three groups including 13 local large clusters (≥ 10 cases) from 2008 to 2016. Years are shown along the x-axis and the number of new diagnoses for each cluster or all large clusters (≥ 10 cases) is shown along the y-axis. Orange and blue columns indicate recent and chronic HIV infection, respectively.

