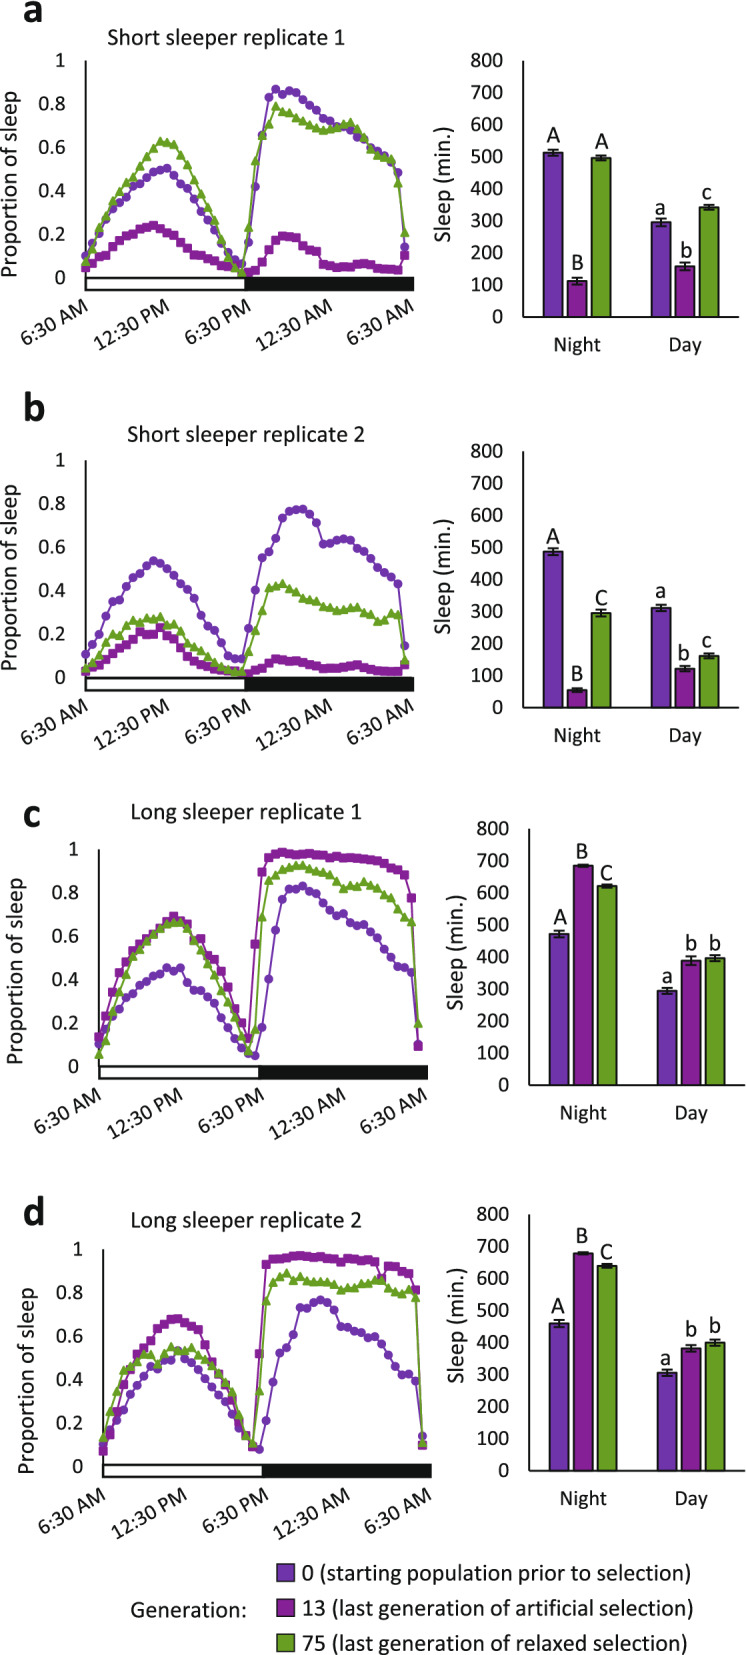
Figure 1.

Sleep measured at Generation 75 shows the response to 62 generations of relaxed selection. Sleep duration in the last generation of relaxed selection, Generation 75, is contrasted with that in Generation 0, the starting unselected population, and that of Generation 13, the last generation of artificial selection. The mean proportion of night and day sleep duration are plotted in 30-min bins across time for all flies in the experiment. The white bar on the x-axis indicates day, while the black bar indicates night. Mean night and day sleep duration are quantified in the bar charts. Error bars are standard errors of the mean. (A) short sleep replicate 1 (n = 165, 102, and 198 flies in generations 0, 13, and 75, respectively). (B) short sleep replicate 2 (n = 199, 158, and 194 flies in generations 0, 13, and 75, respectively). (C) long sleep replicate 1 (n = 159, 153, and 193 flies in generations 0, 13, and 75, respectively). (D) long sleep replicate 2 (n = 199, 190, and 191 flies in generations 0, 13, and 75, respectively). Means with different letters are significantly different by post-hoc Tukey test (P < 0.05).
