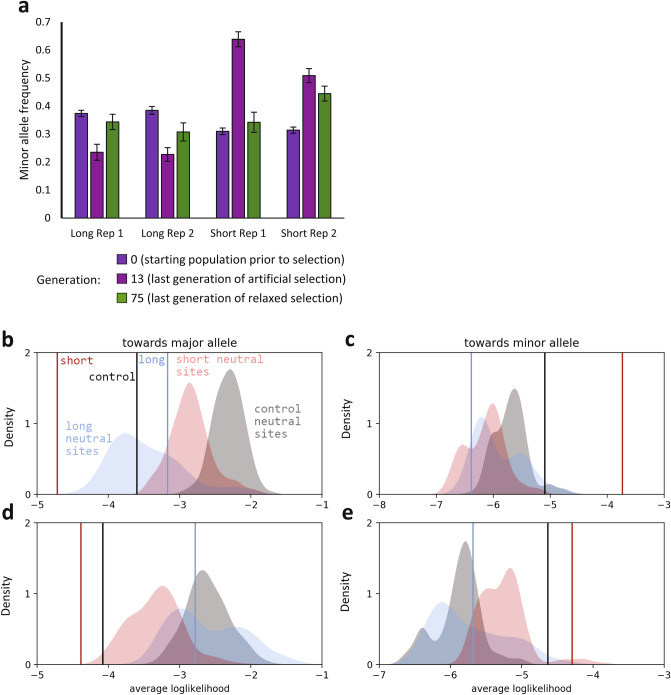
Figure 3.
Allele frequency changes in sleep polymorphisms suggest that natural selection acts to maintain moderate sleep duration. (A) Generation 0 shows average minor allele frequencies in the starting unselected population; Generation 13 shows average minor allele frequencies in the last generation of artificial selection; and Generation 75 shows average minor allele frequencies in the last generation of relaxed selection. All allele frequencies are calculated relative to the minor allele as defined in Generation 0 of the SAIP. (B–E) The average loglikelihood for each population for random drift is plotted as a vertical line in relation to the distribution of loglikelihoods of random drift obtained by sampling 126 random (i.e., putatively neutral) polymorphisms 1000 times from the Generation 12 and Generation 75 sequences. Allele frequencies are split according to those that changed towards the major allele from Generation 12 to Generation 75 and those that changed towards the minor allele from Generations 12 to Generation 75. (B,C) replicate 1 populations; (D,E) replicate 2 populations. Red indicates the short sleeper mean likelihood and corresponding distribution of neutral polymorphisms; blue indicates the long sleeper mean likelihood and corresponding distribution of neutral polymorphisms; and black indicates the control mean likelihood and corresponding distribution of neutral polymorphisms.

