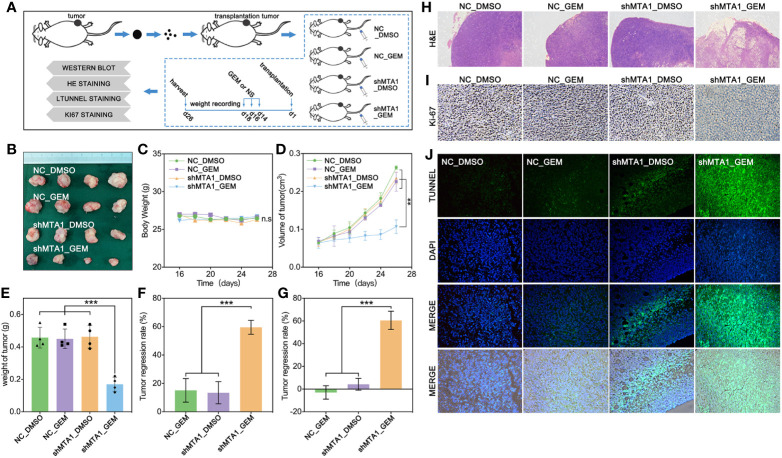
Figure 4.
MTA1 knockdown enhanced gemcitabine mediated tumor growth restriction effect in vivo. (1) Experiments processed in vivo (A). (2) Volume of subcutaneous transplantation tumor (B). (3) Weight of mouse (C). (4) Volume of tumors in vivo (D). (5) Weight of tumors (E). (6) Calculation of tumor growth inhibition by volume (F) and weight (G), respectively. (7) H&E staining (H), ki-67 staining (I) and tunnel assay, in which the green area means death (J).

