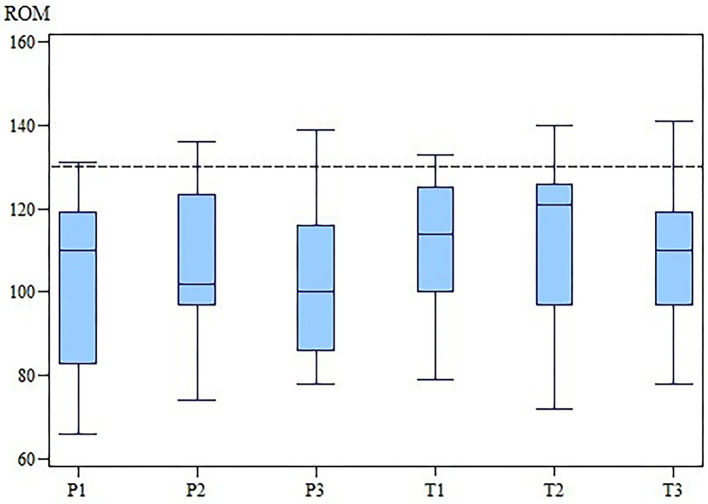
Figure 3.
ROM of the affected elbow joint of the TG and the PG at M1, M2 and M3. While in the PG the ROM worsened, for TG there is an improvement at M2 and a drop down at M3. The differences between groups were not statistically significant. ROM, range of motion; TG, treatment group; PG, placebo group; M, measurement point. x-axis: Range of motion (ROM) in degree (°). y-axis: group (T for TG; P for PG) and measurement time (2 for M2; 3 for M3).

