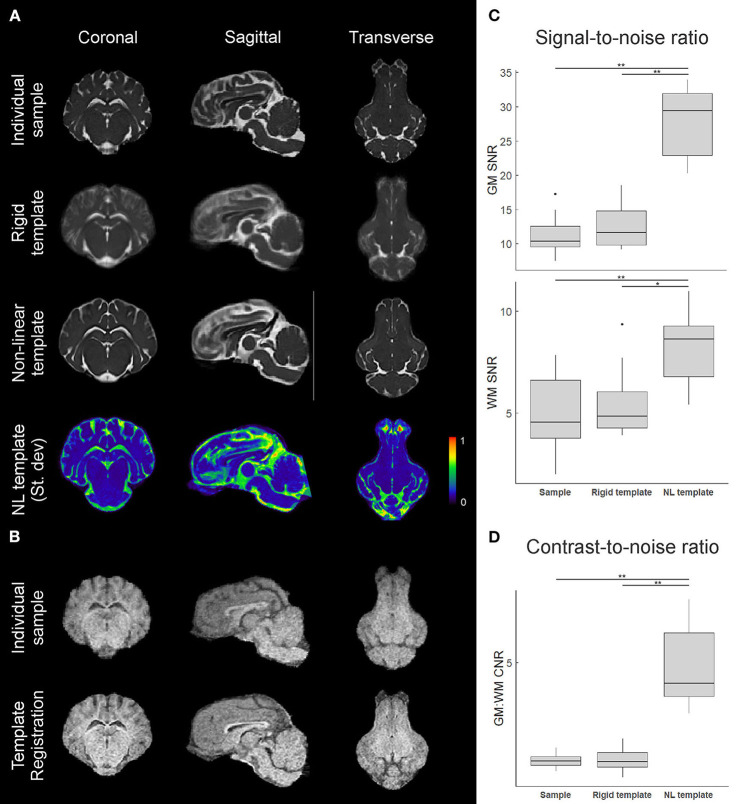
Figure 4.
Comparison of individual and template datasets. (A) T2-weighted datasets registered to the common stereotactic space for visual comparison between an individual sample, the rigid-body co-registration population average (rigid template), and the non-linearly transformed brain template. Mid-coronal, mid-sagittal, and mid-transverse slices are shown. A 3D plot of the normalized voxel-wise standard deviation for the T2 non-linear template is also shown, with a slightly lower transverse slice shown to visualize the olfactory bulb. Areas in red indicate relatively higher inter-subject structural variability. (B) Similar visualizations comparing an individual sample T1 image and the T1 template (n = 3) formed through multimodal registration to the T2 template space. (C) Calculated gray matter (GM) and white matter (WM) signal-to-noise ratios (SNR) for an individual image, the rigid template, and the non-linear template, based on caudate nucleus and corpus callosum sampling. (D) Calculated gray matter to white matter contrast-to-noise ratios (CNR) for each image based on the SNRs from (C). Boxplots show median, 25/75% quartiles, and whiskers extending to the smallest or largest value no further than 1.5 times the interquartile range from the hinge. Points beyond this range are shown as outlier dots. *p < 0.05, **p < 0.01.

