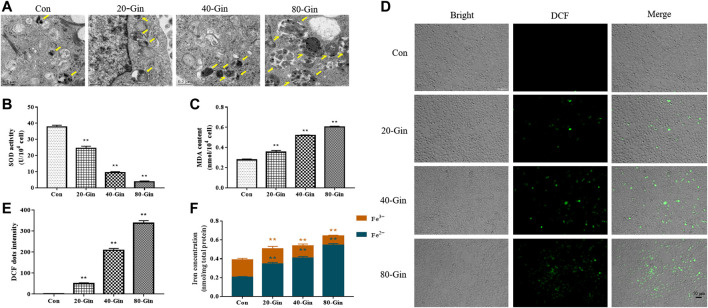
FIGURE 4.
6-Gingerol exacerbates autophagy and enhances the accumulation of ROS and iron in A549 cells. (A) The autophagy electron microscope image of A549 cells, and yellow arrows marked the autophagy structure; (B) The activity of SOD in A549 cells; (C) The content of MDA in A549 cells; (D) The ROS fluorescence (DCF) of A549 cells; (E) The histogram of ROS content of A549 cells; (F) The iron concentration in A549 cells. Con: control, 20-Gin: 20 μM 6-Gingerol, 40-Gin: 40 μM 6-Gingerol, 80-Gin: 80 μM 6-Gingerol. Compared with the control group, *p < 0.05, **p < 0.01. Data are expressed as mean ± SD (n = 3).

