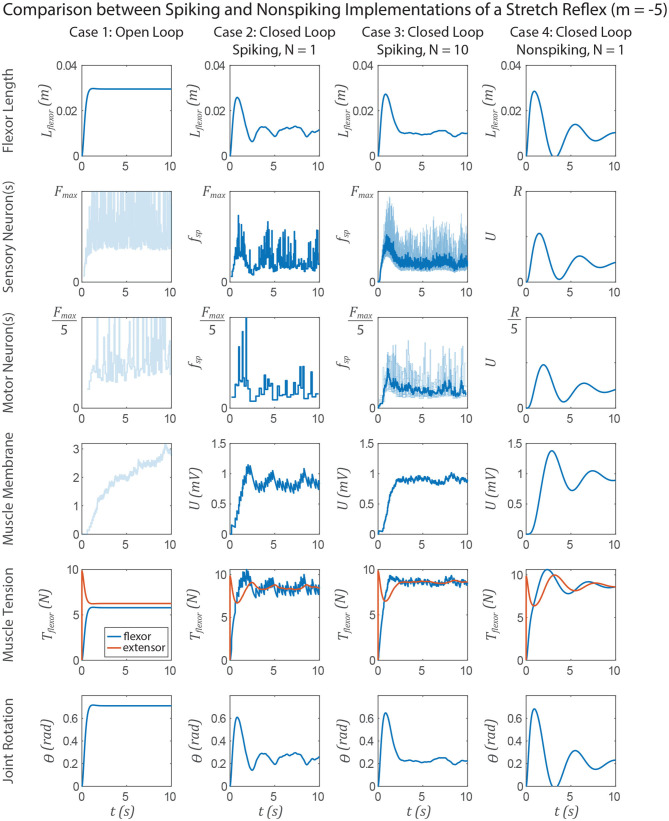
Figure 12.
Data from a simulation of the system in Figure 1. Each column shows data from a different configuration of the system, from left to right: Case 1, open loop; case 2, spiking reflex pathway, N = 1; case 3, spiking reflex pathway, N = 10 (fsp for every neuron is shown in light blue, population mean fsp is plotted in dark blue); case 4, non-spiking reflex pathway. All corresponding axes are scaled the same. Each row plots data from a different stage of the reflex loop as depicted in Figure 1. In this figure, all spiking neurons have a variable spiking threshold θ (i.e., m = −5).

