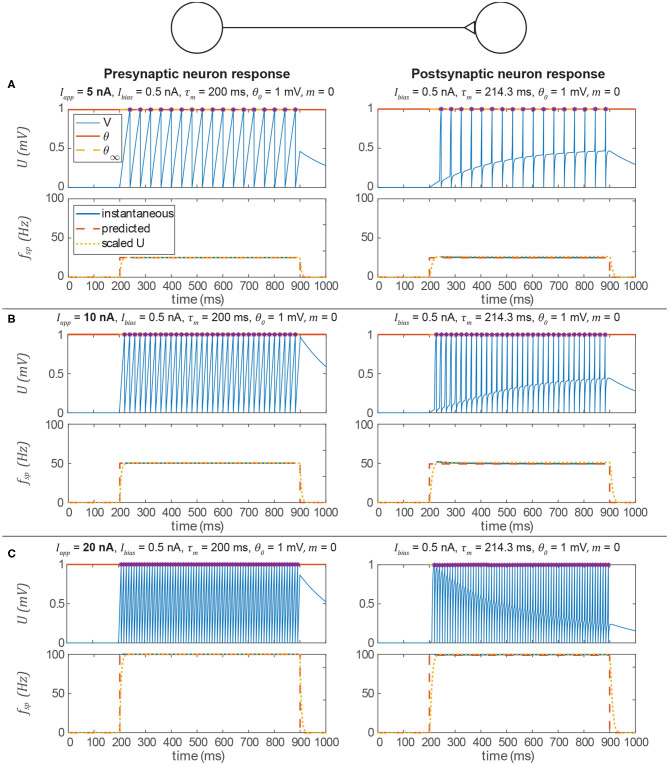
Figure 5.
Data from three simulations testing a signal transmission pathway where ksyn = 1 with different applied currents (Iapp) to the pre-synaptic neuron. In each section, the upper row is the membrane voltage, and the lower row is the instantaneous spiking frequency plotted vs. time. In every case, the post-synaptic neuron's spiking frequency is the same as the pre-synaptic neuron's spiking frequency and is consistent with the prediction from the analysis above. In addition, it is approximately equal to for the equivalent non-spiking network. Spikes are indicated by violet asterisks (no “cosmetic spikes” are plotted). (A) Response to a 5 nA current applied to the presynaptic neuron. (B) Response to a 10 nA current applied to the presynaptic neuron. (C) Response to a 20 nA current applied to the presynaptic neuron.

