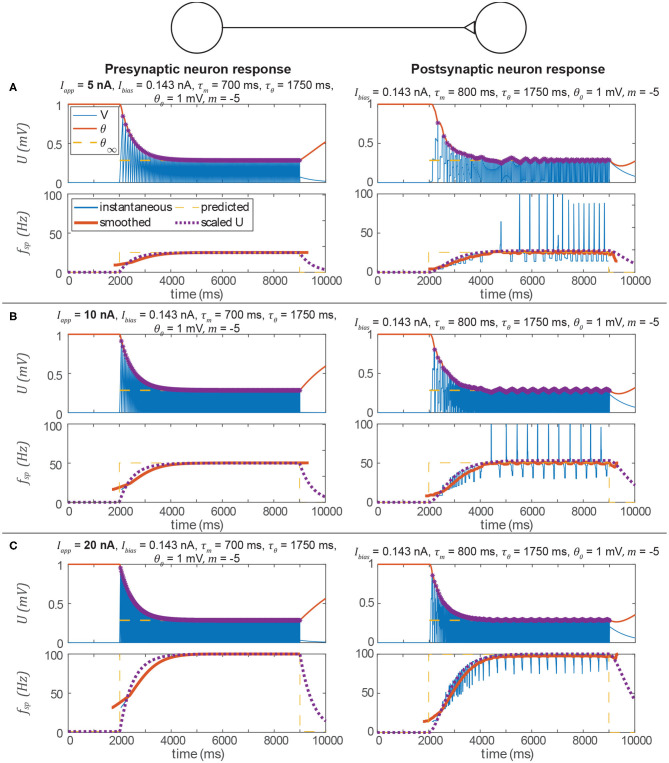
Figure 6.
Data from three simulations testing the signal transmission pathway. In each section, the left column is the pre-synaptic neuron's activity, the right column is the post-synaptic neuron's activity, the upper row is the membrane voltage, and the lower row is the instantaneous spiking frequency (inverse of the time between two spikes) plotted vs. time. In every case, the post-synaptic neuron's spiking frequency is the same as the pre-synaptic neuron's spiking frequency, and consistent with the prediction from the analysis above. In addition, the transient spiking frequency of each neuron follows the transient membrane voltage of the analogous non-spiking pathway. Spikes are indicated by violet asterisks (no “cosmetic spikes” are plotted). (A) Response to a 5 nA current applied to the presynaptic neuron. Note that the presynaptic neuron's low spiking frequency causes large fluctuations in the postsynptic neuron's spiking frequency. (B) Response to a 10 nA current applied to the presynaptic neuron. Due to the higher spiking frequency, fluctuations in the postsynaptic neuron's spiking frequency appear less severe than in A. (C) Response to a 20 nA current applied to the presynaptic neuron. Fluctuations in the postsynaptic neuron's spiking frequency are not severe.

