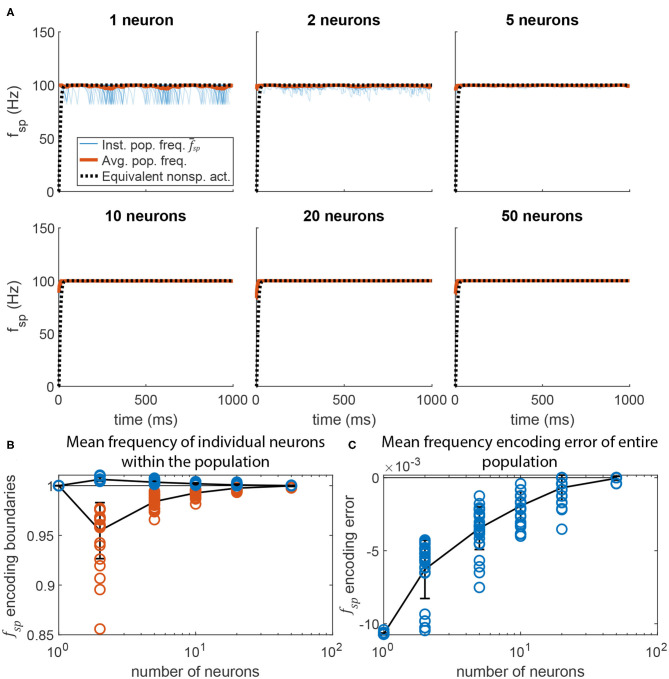
Figure 9.
Adding more neurons to the pre-synaptic and post-synaptic populations increases encoding accuracy and reduces activation variation. (A) Average spiking frequency of the post-synaptic population over time when the spiking threshold θ is constant (i.e., m = 0) for all neurons. Thirty individual trials (blue), the mean over time (red), and the equivalent non-spiking pathway (black dotted) are plotted. (B) The highest (blue circles) and lowest (red circles) mean frequency of a single neuron in the population. Line plots the mean of each group, error bars are ±1 standard deviation. (C) The error between the mean spiking frequency of the entire population and the intended spiking frequency for each trial (blue circles). Line plots the mean, error bars are ±1 standard deviation.

