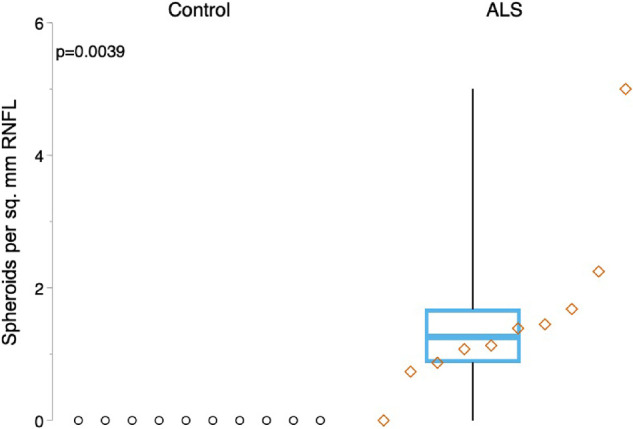
Figure 6.

Increased density of P-NF–positive spheroids in the retinas of patients with ALS. Boxplots show the density distribution of P-NF–positive spheroids in the RNFL. Spheroid density is significantly increased in patients with ALS (right) compared with controls (P = 0.004). For each boxplot, the center line represents the median. The upper and lower limits of each box represent the 75th and 25th percentiles, respectively. Individual data points are displayed as open circles for controls and open diamonds for patients with ALS.
