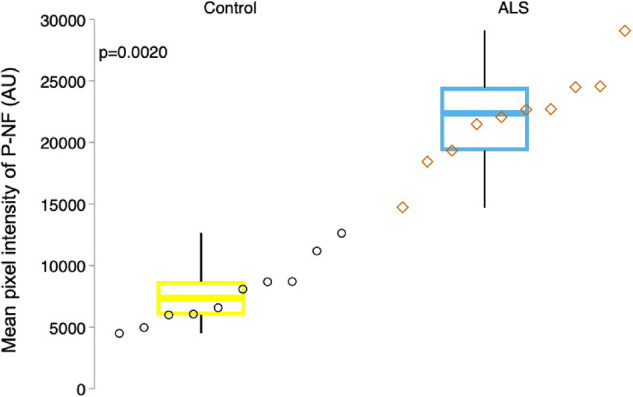
Figure 7.

Increased phosphorylated neurofilament in the retina of patients with ALS. Boxplots show the intensity distribution of P-NF immunofluorescence in the RNFL in all retinal regions. P-NF intensity is significantly increased in patients with ALS (right) compared with controls (P = 0.002). For each boxplot, the center line represents the median. The upper and lower limits of each box represent the 75th and 25th percentiles, AU = arbitrary units. Individual data points are displayed as open circles for controls and open diamonds for patients with ALS.
