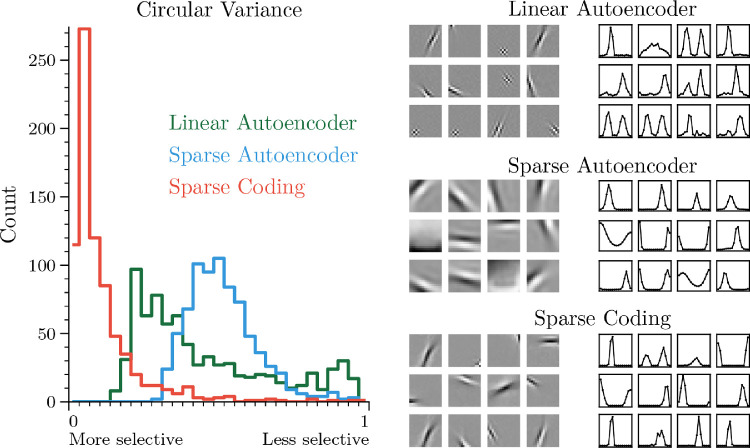
Figure 4.
LCA neurons are more selective to oriented gratings than linear or sigmoid nonlinear neurons. On the left is a histogram of the circular variance (Ringach et al., 2002), a measure of orientation selectivity, for all of the neurons in each model. In the middle, we show a random sampling of weights learned by each model. On the right, we show corresponding orientation response curves. For the response curves, the horizontal axis represents the angle of the input stimulus, which varies from 0 to . The vertical axis is the response of the neuron and has been normalized by dividing the response by the maximum across the 36 neurons shown. All networks received 256 pixel inputs and have 768 latent units.

