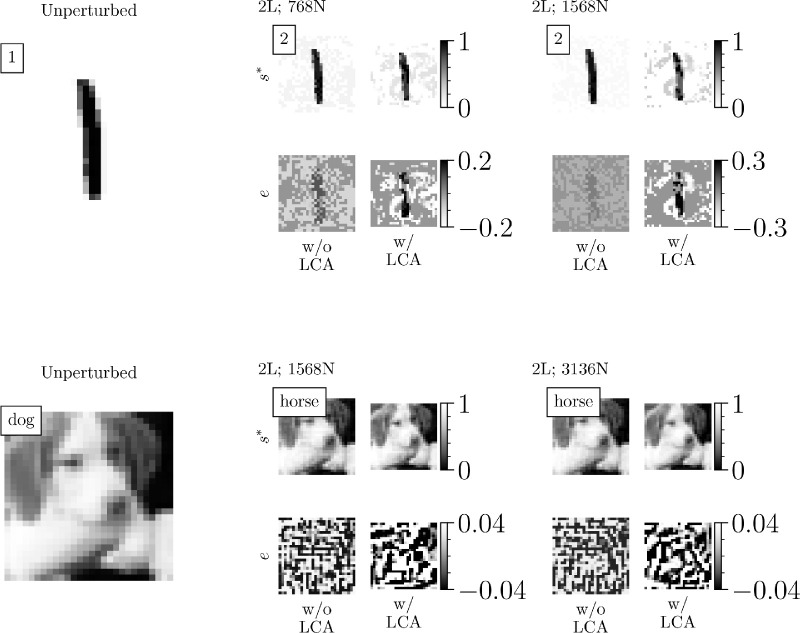
Figure 8.
LCA influences perturbation magnitudes and directions. Images are visualizations of example data points from Figure 7. The boxed text in the top left of the images indicates the original or target label. is the input image at whatever time step corresponded to 95% classifier confidence in the target label and is the perturbation that was added to the original image. The MNIST colors are inverted to make the perturbations more visible.

