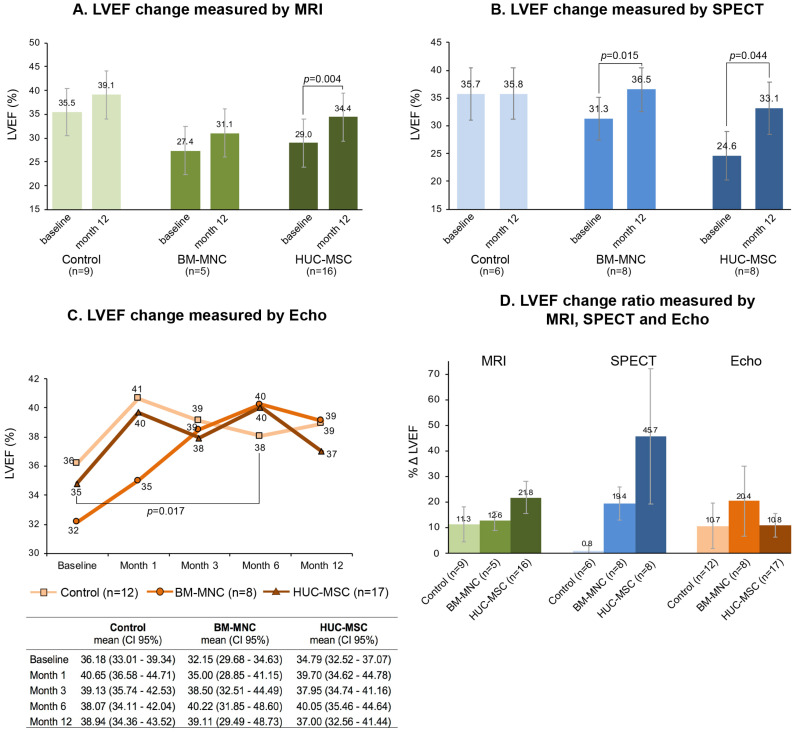
Fig. 2.
Changes in LVEF (%) measured by MRI (A); SPECT (B); Echo (C), and calculated LVEF change ratio (ΔLVEF) at baseline and after 12-month follow-up (D). (A) LVEF significantly increased only in HUC-MSC group (p=0.004); did not significantly change in the control or BM-MNC groups (see, text for p values). (B) SPECT imaging presented significant LVEF increase both in BM-MNC (p=0.015) and HUC-MSC (p=0.044) groups. (C) LVEF (baseline to 6 month) detected using Echo, and was also found different only in HUC-MSC group (p=0.017). Mean LVEF (%) and confidence intervals (CI 95%) at certain time-points are given in the table below. (D) Cumulative LVEF change ratio in each patient (ΔLVEF) in MRI, SPECT, and Echo revealed no significance between groups (p=0.376; p=0.110, and p=0.765, respectively).

