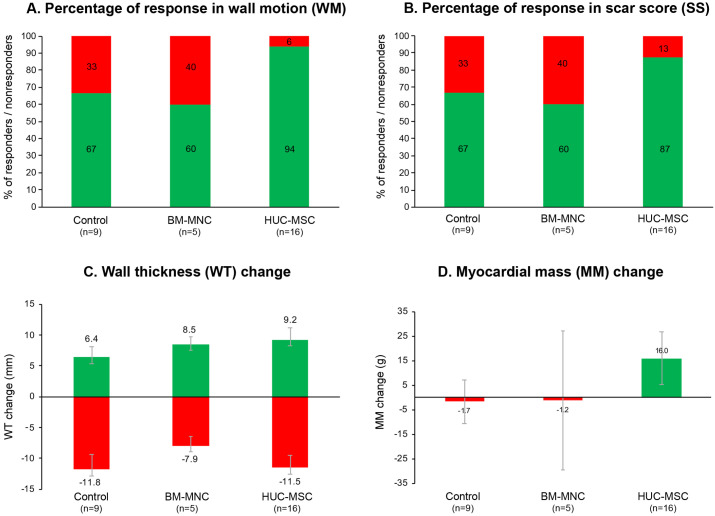
Fig. 3.
Ratio of responder vs nonresponder and left ventricle measurements based on the segmental MRI evaluations. (A, B) represent the ratio of responder (green bars) vs nonresponder (red bars) due to the healing of wall motion (WM) and scar score (SS), respectively. (C) Wall thickness (WT) change (mm) showed no significant difference between the groups (χ2=2.400; p=0.301). (D) Myocardial mass (MM) change (grams) between the baseline and after the 12-month follow-up was not different within each group (p=0.850) or between groups (p=0.440). However, a striking MM increase (16±10.6 g) was noted only in HUC-MSC group, whereas MM decreased in the control and BM-MNC groups. Although none of the measured/calculated values based on the segmental analysis (wall motion, scar score, wall thickness and myocardial mass) exhibited significant difference among groups, these results demonstrated that a higher degree of healing effect in the HUC-MSC group (compare the values in the A∼D).

