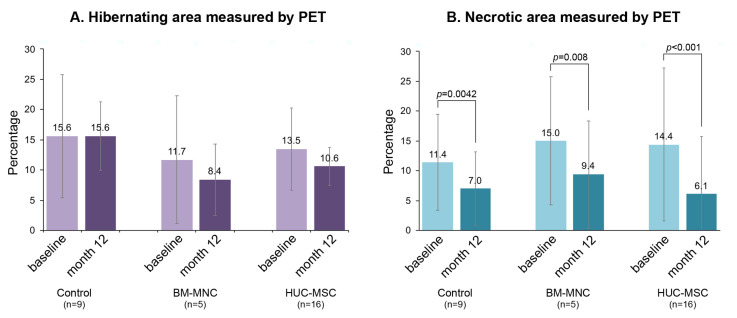
Fig. 4.
Changes (percentage) in hibernating (A) and necrotic area (B) measured by PET. Cell-treated groups demonstrated a decrease in hibernating area; no significance difference was noted among groups or within each group. Varying and significant decreases were noted in the necrotic myocardium (baseline–12-month) as 2.3% in the control (Z=2.033; p=0.042), 4.5% in BM-MNC (Z=2.666; p=0.008), and 7.7% in the HUC-MSC (Z=3.517; p<0.001) groups. Graphics were drawn using median and error bars were given as IQR/2.

