Figure 5.
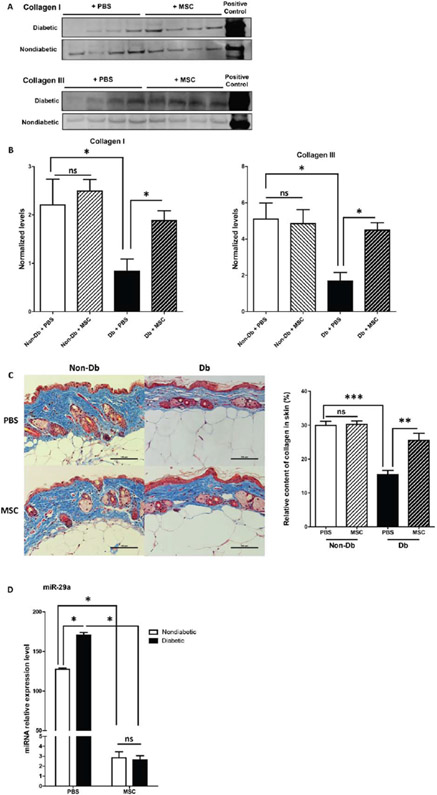
Effect of MSC treatment on collagen and miR-29a levels in diabetic and nondiabetic murine skin. (A) Western blot depicting collagen I and III protein levels in 16-week-old nondiabetic and diabetic murine skin treated with MSCs or PBS for 28 days. (B) Quantification of collagen I and III protein by Western blot. C: Masson’s trichrome stain of representative sections of diabetic and nondiabetic skin after 28 days of treatment with 1 × 10⁶ MSC (n = 5) or PBS (n = 5) and graphical representation of collagen (blue stain) content quantification from masson’s trichrome staining. (D) Relative expression of miR-29a in diabetic and nondiabetic murine skin treated with MSC or PBS for 28 days. Data was analyzed by one-way ANOVA followed by Bonferroni’s post hoc test (*p < 0.05; **p < 0.001; ***p < 0.0001; ns = nonsignificant).

