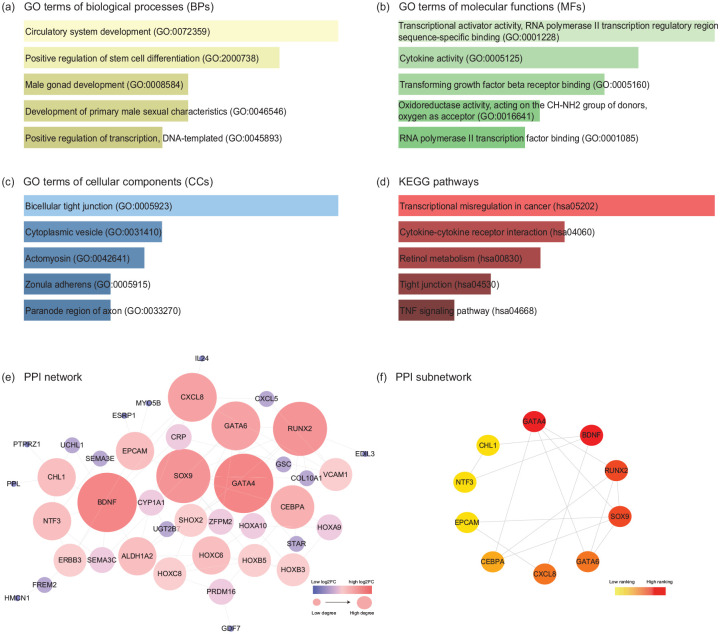
Figure 4.
GO, KEGG pathway, and PPI network analyses of DEGs in the EMs-related ceRNA network. The top 5 enriched (a) biological processes, (b) cellular components, (c) molecular functions, and (d) KEGG pathways of DEGs in the ceRNA network. The horizontal axis represents the number of genes, and the vertical axis represents GO terms or KEGG pathway names. All entries were ranked by p-value in the ascending order. (e) PPI network constructed by the DEGs in the ceRNA network. According to the degree score calculated by plugin NetworkAnalyzer, the node colour changes gradually from blue to red and the node sizes from small to large in the ascending order. (f) 10 hub DEGs in the PPI network analyzed by the “Degree” method in plugin CytoHubba. The node colour changes gradually from yellow to red in the ascending order according to the degree score. GO, gene ontology; KEGG, Kyoto Encyclopedia of Genes and Genomes; PPI, protein-protein interaction; DEGs, differentially expressed genes.

