Figure 1.
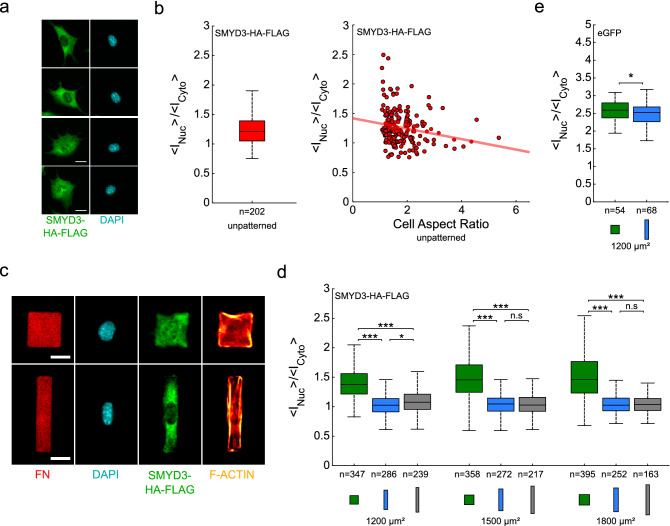
Cell geometry on fibronectin micropatterns regulates SMYD3 distribution. (a) Myoblast C2C12 cells expressing SMYD3-HA-FLAG plated on fibronectin coated substrates. Scale bars: 20 µm. (b) Quantification of the nuclear:cytoplasmic (<INuc>/<ICyto >) distribution ratio for SMYD3-HA-Flag for cells spread on non-patterned substrates, and nuclear:cytoplasmic ratio of SMYD3-HA-Flag as a function of cell aspect ratio for cells spread on non-patterned substrates. The red line represents a linear regression (n = 202). (c) Myoblast C2C12 cells expressing SMYD3-HA-FLAG were plated on fibronectin micropatterns with the same area (1200 μm2), but different aspect ratios; square (1:1, upper panel) or rectangle (1:5, lower panel). The micrographs show the fibronectin (FN) patterning, the nuclear DNA staining (DAPI), SMYD3-HA-Flag protein location and F-actin (SiR-actin). The SMYD3 nuclear:cytoplasmic distribution appears different between square and rectangle patterns. Scale bars: 20 µm. (d) Quantification of the nuclear:cytoplasmic (< INuc > / < ICyto >) distribution ratio for SMYD3-HA-Flag over a range of pattern areas (1200–1800 μm2) and geometries: squares (1:1 aspect ratio, green), rectangles (1:5 aspect ratio, blue) and elongated rectangles (1:8 aspect ratio, grey).The median value of the ratio is 27–42% higher for cells plated on squares than on rectangle patterns. A Kruskal–Wallis test was performed between conditions with identical areas. (e) Quantification of the nuclear:cytoplasmic (<INuc>/<ICyto>) distribution ratio for control eGFP transfected into C2C12 cells on square or rectangle patterns (1200 μm2). The eGFP nuclear:cytoplasmic distribution is slightly different (less than 3%) between square and rectangle patterns. A two-sample t-test was performed. n = number of individual cells measured. *p < 0.05, ***p < 0.001, n.s. not statistically significant.

