Figure 2.
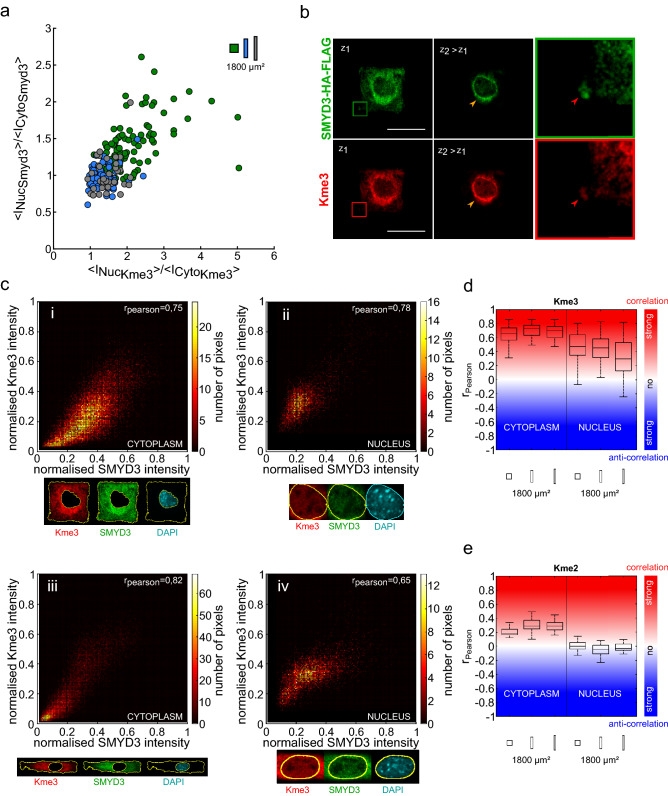
SMYD3 cellular distribution correlates with the lysine trimethylation (Kme3). (a) The increased nuclear distribution of SMYD3-HA-FLAG on square patterns (green dots; n = 105) correlates with higher nuclear staining for lysine tri-methylation marks (Kme3). Conversely, rectangle patterns (blue and grey spots; n = 68 and 37, respectively) have higher SMYD3 and Kme3 levels in the cytoplasm. (b) Confocal microscopy images of a C2C12 cell spread on a square micropattern, showing the co-localisation of SMYD3-HA-FLAG (green) and lysine tri-methylation Kme3 (red) marks. The magnified square highlights SMYD3/Kme3 colocalisation. Scale bars: 30 µm. (c) Upper panels: Detailed representation of the SMYD3 and Kme3 co-localisation within (i) the cytoplasm and (ii) the nucleus for a cell spread on a square micropattern. Lower panels: the same quantification for a cell spread on a rectangle micropattern showing cytoplasmic (iii) and nuclear (iv) quantification. (d) Graphical representation of the correlation (Pearson coefficient) between SMYD3 and Kme3 lysine tri-methylation localisation. n = numbers of individual cells measured: square n = 105, rectangle 1:5 n = 68, rectangle 1:8 = 37. (e) Graphical representation showing a quantified lack of correlation (Pearson coefficient) between SMYD3 and Kme2 lysine di-methylation localization. n = numbers of individual cells measured: square n = 24, rectangle 1:5 n = 18, rectangle 1:8 n = 19.

