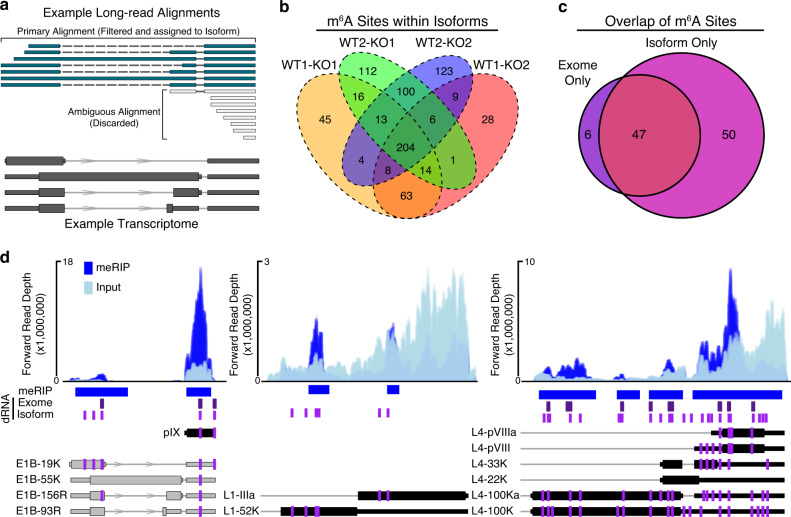
Fig. 4. Exome versus isoform-level m6A analysis.
a Example of read filtering. Overlapping RNA isoforms are shown in dark gray. Sequence reads that map unambiguously (teal) are filtered and retained for m6A analysis. Sequence reads with multiple primary alignments (gray) are discarded if no single alignment is considered superior. b Isoform-level comparisons between WT and M3KO datasets yields 747 candidates (post-collapse) of which 204 are consistently detected across all four comparisons. c Overlap of all m6A sites detected in 4/4 exome-mapped replicates and 4/4 isoform-mapped replicates. Isoform only candidates were collapsed to unique genomic loci. d Representative plots showing isoform-specific m6A predictions on adenovirus transcripts. MACS2 peaks and meRIP-seq signal (blue) is shown on top. Direct RNA (dRNA) predicted m6A sites at the exome-level (purple) or isoform-level (magenta) are shown below meRIP peaks as vertical lines. The positioning of m6A within individual viral transcripts from Fig. 2 are shown as magenta lines. Transcript names are shown to the left of each transcript.

