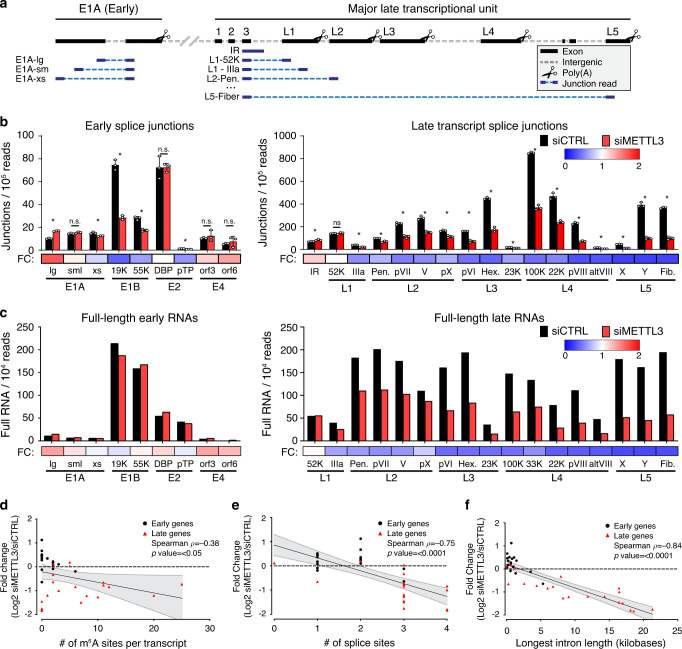
Fig. 7. METTL3 knockdown globally dysregulates adenoviral late RNA processing.
a Schematic showing how junction-containing splice reads generated by Illumina sequencing can be used to predict specific transcript abundances when genes overlap. Short reads (dark blue) aligning specifically to viral exons (black) were filtered for the presence of a splice junction (dashed light blue line) that was only present in one viral transcript. b Splice junction containing reads indicative of adenovirus transcripts present in Illumina RNA-Seq data generated after infection of A549 cells where METTL3 was depleted by siRNA. Splice junction read depth was normalized to the total amount of reads mapping to both human and viral RNA per library. Early viral transcripts are shown on the left, MLP-derived late transcripts shown on the right. Fold-change (FC) between control siRNA and siMETTL3 for each transcript was plotted as a heatmap below the bar chart. Data depict three biological replicates with error bars showing standard deviation. For all assays significance was determined by unpaired two-tailed Student’s T-test, where *p ≤ 0.05 and ns = not significant. Graphs represent means +/− standard deviation. c Independently derived RNA was sequenced by ONT after METTL3 knockdown and adenovirus infection to yield full-length RNA sequences indicative of the labeled early and late viral transcripts. Fold-change (FC) between control siRNA and siMETTL3 for each transcript was plotted as a heatmap below the bar chart. d Individual viral transcripts are plotted as a function of log2 fold change of the siMETTL3/siCTRL data from Fig. 7c and the number of isoform-level m6A sites detected in Fig. 2a. Canonical early genes are coded with black squares and canonical late genes coded with red triangles, however the entire dataset was analyzed by Spearman’s correlation test to yield a correlation rho (ρ) value and significance p-value. e Analysis performed as in d, but with log2 fold change and the total number of splice sites contained within each viral transcript. f Analysis performed as in d, but with log2 fold change and the length (in nucleotides) of the longest intron contained within each viral transcript. For panels d–f the black line represents the calculated best-fit linear regression, and the shaded gray area represents 95% confidence interval. Exact p-values are included in the source data file.

