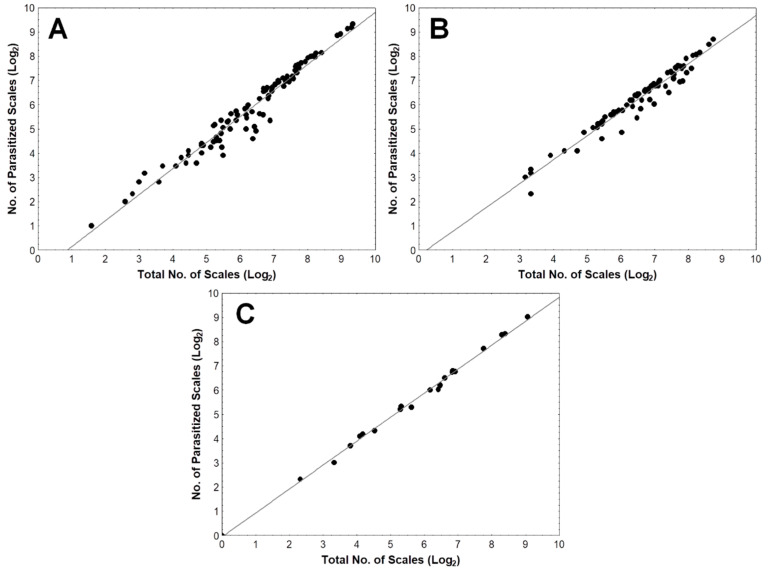
Figure 5.
Correlation and regression of the number of parasitized scales against the total number of scales across the three sampling periods: (A) August 2014 (r = 0.9764, r2 = 0.9534, p = 0.0000); (B) December 2014 to January 2015 (r = 0.9764, r2 = 0.9535, p = 0.0000); (C) June 2015 (r = 0.9988, r2 = 0.9976, p = 0.0000).

