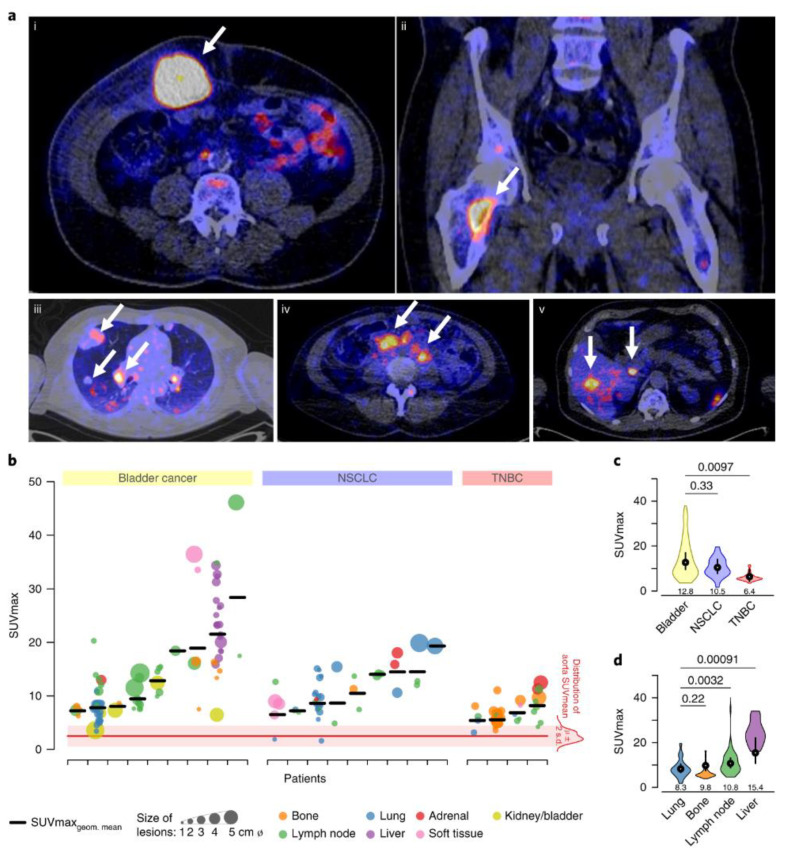
Figure 2.
89Zr-atezolizumab tumor uptake. (a) Examples of PET/CT images of four patients illustrating 89Zr-atezolizumab tumor uptake in five different locations on day 7 post injection (white arrows indicate tumor lesions; PET scans were performed once per patient and time point). Images (i) and (ii) are from the same patient, whereas images (iii), (iv), and (v) are from a separate patients. (b) Overview of 89Zr-atezolizumab uptake as SUVmax at day 7 post injection in 196 tumor lesions with a diameter >2 cm grouped per tumor type and ordered by increasing geometric mean SUVmax per patient, visualizing tumor size and site, and with blood pool background uptake as reference. Horizontal bar indicates geometric mean SUVmax per patient. (c) Violin plot of actual distribution of SUVmax in lesions per site of lesion with bottom and top 1% of SUVmax values truncated (first, fiftieth, and ninety-ninth SUVmax percentiles: 1.7, 7.9, 19.6 for lung; 3.9, 5.6, 16.4 for bone; 4.6, 9.7, 40.1 for lymph node; 16.1, 23.3, 34.1 for liver); black vertical lines are 95% CIs of geometric mean SUVmax; white dots within black lines and values below the violin plot are the actual geometric means, all based on a linear mixed regression model with two-sided Wald p values using Satterthwaite approximations to degrees of freedom under restricted maximum likelihood, shown above the graph; nlung = 44 in ten patients, nbone = 62 in nine patients, nlymph node = 54 in 20 patients, nliver = 19 in one patient. (d) Violin plot of SUVmax in lesions per tumor type with bottom and top 1% of SUVmax values truncated (first, fiftieth, and ninety-ninth SUVmax percentiles: 3.6, 10.9, 38.0 for bladder; 1.7, 9.7, 19.6 for NSCLC; 3.4, 5.6, 11.7 for TNBC); black vertical lines are 95% CIs of geometric mean SUVmax; white dots within black lines and values below the violin plot are the actual geometric means, all based on a linear mixed regression model with two-sided Wald p values using Satterthwaite approximations to degrees of freedom under restricted maximum likelihood, shown above the graph; nbladder = 85 in nine patients, nNSCLC = 43 in nine patients, nTNBC = 68 in four patients from [155].

