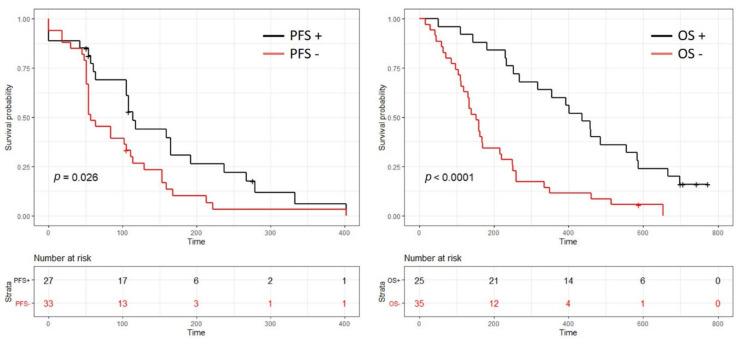
Figure 1.
Kaplan–Meier plots for both progression free survival (PFS) (left side) and overall survival (OS) (right side). The black curve identifies the patient whose blood-based transcriptomic profile is favorable to gemcitabine treatment as a 1st line therapy. The red curve identifies the patient whose blood-based transcriptomic profile is unfavorable (a low response and risk of potential toxicities) to gemcitabine treatment as a 1st line therapy.

