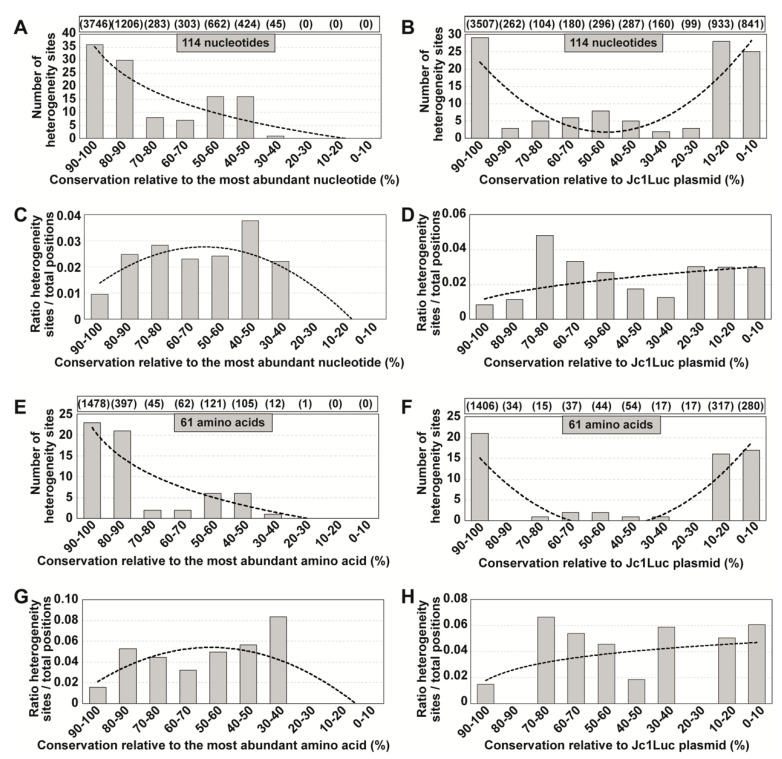
Figure 5.
Distribution of sites of heterogeneity in HCV quasispecies among residue conservation groups defined according to LANL. Sites of heterogeneity are those identified within HCV genomic residues 2769 and 9377 (H77 numbering). In this case, the analysis was performed separately with 983 sequences of genotype G1 and 129 sequences of genotype G2 (excluding one G2c and one G2k sequence due to the presence of an insertion (https://hcv.lanl.gov/content/sequence/HCV/ToolsOutline.html)). (A) The genomic position at which each heterogeneity site is found is assigned to the conservation range calculated relative to the most abundant nucleotide in each position according to the LANL alignment. Conservation groups are indicated in abscissa, and the number of heterogeneity sites in each group is given in ordinate. The total number of nucleotides that fall in each conservation category is indicated in parenthesis in the upper box. The discontinuous line corresponds to function y = −15.83ln(x) + 35.306 (R2 = 0.7957). (B) Same as A except that the conservation groups in LANL alignment were calculated using the HCV sequence in plasmid Jc1Luc as reference. The discontinuous line corresponds to function y = 1.1439x2 − 11.892x + 32.767 (R2 = 0.6507). (C) Data of A normalized to the number of residues in each conservation group. The discontinuous line corresponds to function y = −0.0012x2 + 0.0103x + 0.0047 (R2 = 0.7036). (D) Data of B normalized to the number of residues in each conservation group. The discontinuous line corresponds to function y = 0.0117x0.4096 (R2 = 0.2824). (E–H) Same as (A–D) but at the amino acid level. In this case, the possible conservation windows covered 0% to 100%. The defining functions are E: y = −10.39ln(x) + 21.797 (R2 = 0.7694); F: y = 0.9015x2 − 9.5106x + 23.7 (R2 = 0.7085); G: y = −0.0023x2 + 0.0222x + 0.0011 (R2 = 0.5193); H: y = 0.0127ln(x) + 0.0178 (R2 = 0.1291). The position of each heterogeneity site is given in Table S3.

