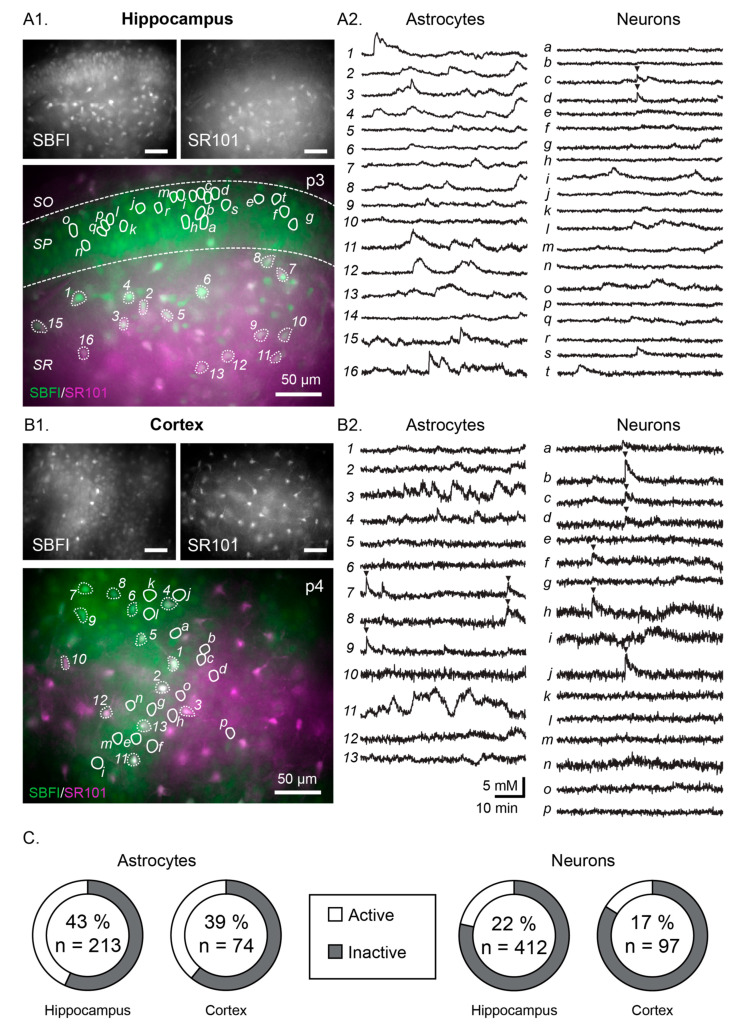
Figure 1.
Example measurements showing spontaneous Na+ fluctuations in the neonate hippocampus (A1,A2) and neocortex (B1,B2). (A1,B1) show the SBFI (top left), SR101 (top right) and merge images (bottom) with all scale bars indicating 50 µm. Circled areas correspond to regions of interest (ROIs), the individual fluorescent measurement traces of which are illustrated in (A2,B2) (astrocytes on the left and numbered, neurons on the right and labelled with letters). Arrows indicate instances when the cells appear to be synchronized. (C) Pie charts indicating the percentage of active astrocytes (left) and neurons (right) within each area (n = total number of cells measured). SBFI: sodium-binding benzofuran isophthalate-acetoxymethyl ester.

