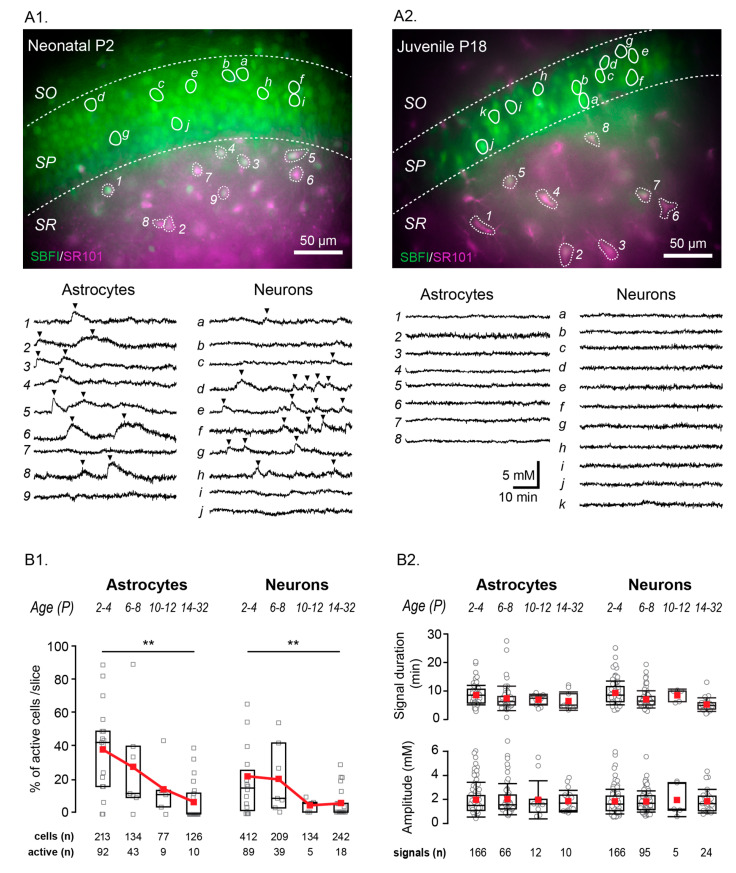
Figure 3.
Age dependence of spontaneous Na+ fluctuations. Example merged staining of a P2 (A1) and P18 (A2) hippocampal slice (SBFI in green, SR101 in magenta, overlapping regions in white) with example cells encircled and their individual fluorescent measurement traces shown below. Analyzed fluctuations are indicated by black arrows. Scale bars show 50 µm. SO, SP, SR: stratum oriens, pyramidale, and radiatum, respectively. (B1) Box plots illustrating the decline in the percentage of cells showing activity per slice with increasing mouse age. (B2) Properties from fluctuations in different age groups, as written above. Box-and-whisker plots indicate the median (line), mean (red square), interquartile range (box), and standard deviation (whiskers). ** 0.001 ≤ p < 0.01.

