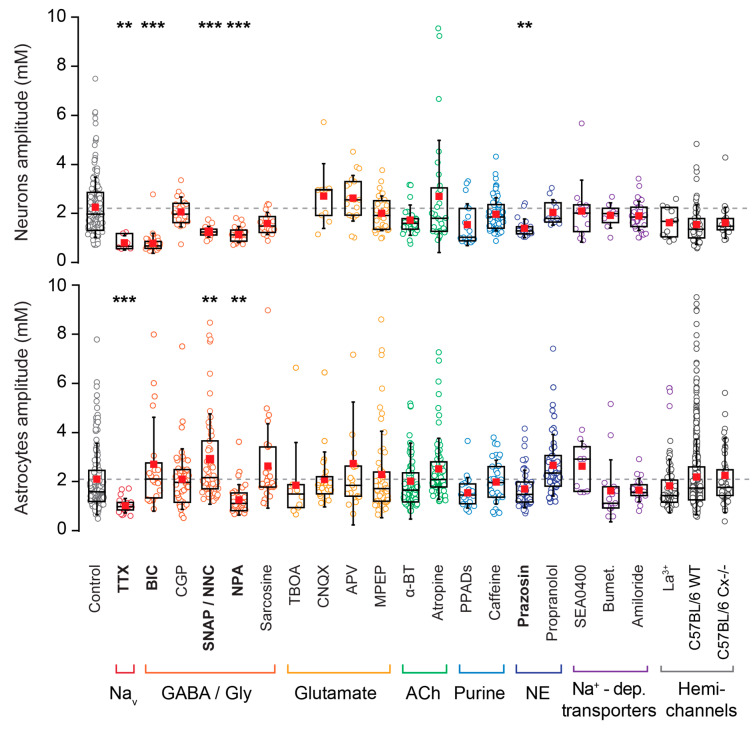
Figure 5.
Pharmacological investigation. Comparison of the fluctuation amplitudes in neurons and astrocytes in the presence of various pharmacological conditions, as detailed in Table 1 and Table 2. Blockers are arranged into color groups according to their target pathway, as indicated below the plots. Abbreviations, see Table 1. Bumet: bumetanide; a-BT: a-bungarotoxin. One data point (10.95 mM) from the astrocytic control group is not shown here. ** 0.001 ≤ p < 0.01, *** p < 0.001.

