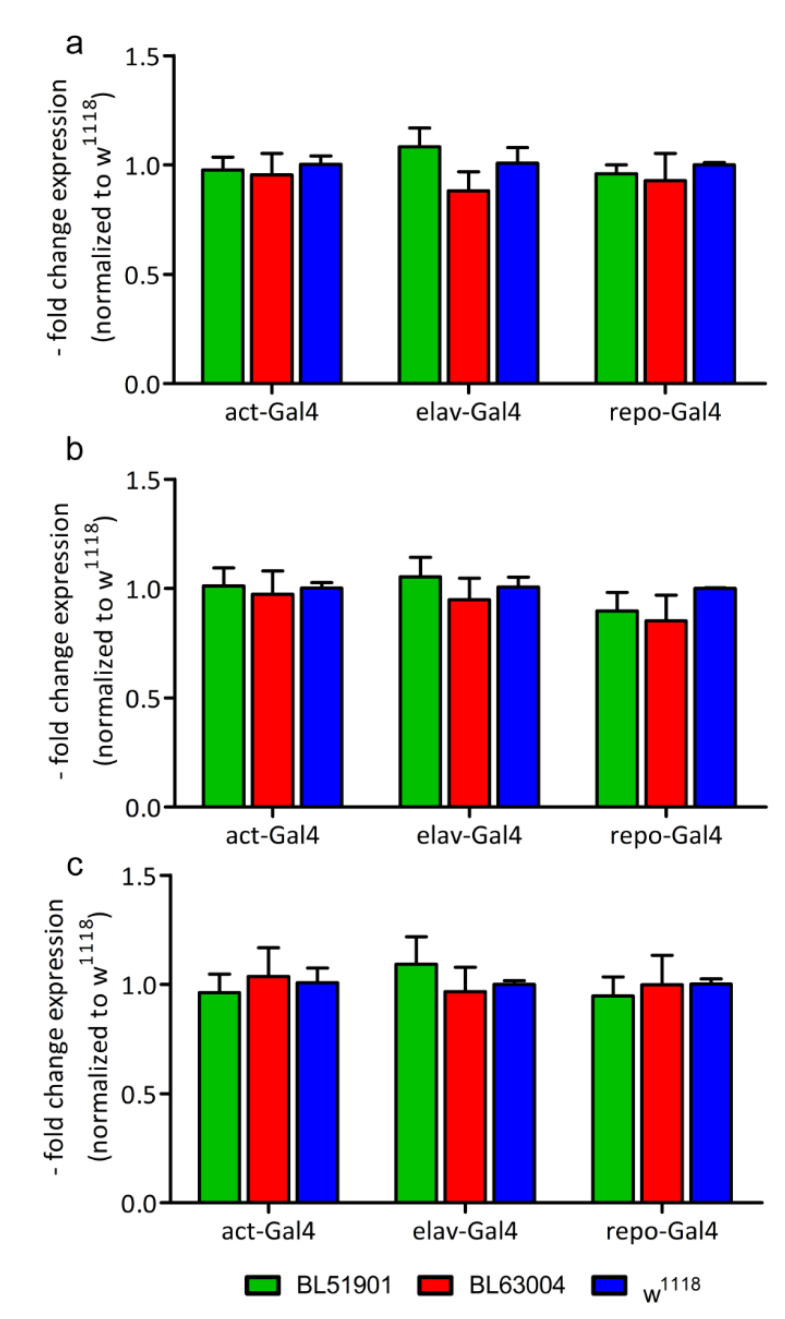
Figure 3.
Molecular analysis of pathology markers. Gene expression of (a) Atg8a, Autophagy-related protein 8a; (b) Lamp1, Lysosomal-associated membrane protein 1; and (c) Rab11, Ras-related protein Rab-11, measured by RT-qPCR. RNAi’s data are normalized to w1118 controls. Data were measured upon ubiquitous (act-Gal4), pan-neuronal (elav-Gal4) and glial (repo-Gal4) knockdown of Ids/CG12014, with 2 different RNAi fly lines (BL51901, BL63004) and w1118 wild type controls. n = 25 flies for act-Gal4, n = 75 heads for elav-Gal4 and repo-Gal4 (all divided in 5 replicates). Results are mean ± s.e.m.

