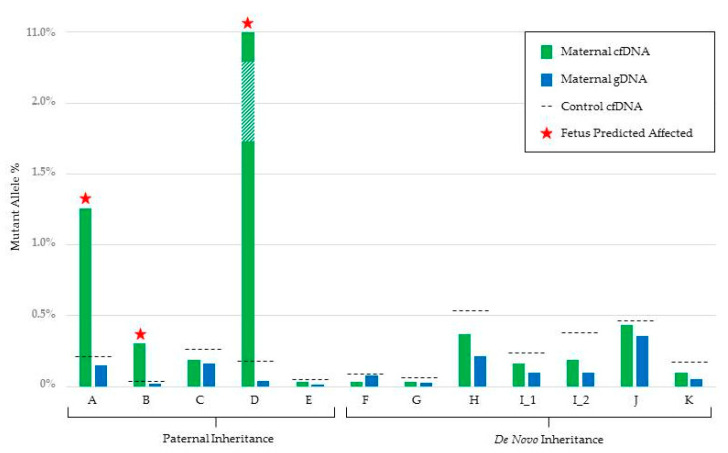
Figure 1.
Graphical representation of the mutant allele % detected in both maternal cfDNA (green) and maternal gDNA (blue) for each family tested by amplicon-based MPS. The maternal cfDNA mutant allele % is an average of two duplicate samples. The maximum mutant allele % detected in the five control cfDNA samples is also shown (black dotted line). Tests reported as predicted to be affected are indicated with a star.

