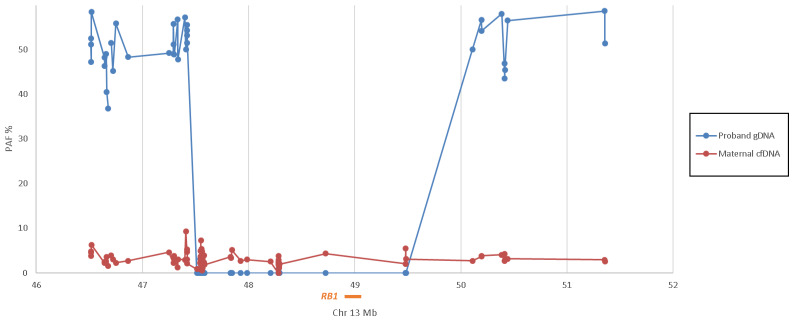
Figure 3.
Graphic representation of the paternal allele frequency (PAF%) across the 5 Mb region of chromosome 13 containing RB1 (orange bar) within the previous affected child (proband) gDNA (blue line) and maternal cfDNA (red line) of Family N. The affected child is hemizygous for chr13:47,515,019–49,482,240. The maternal cfDNA had a calculated fetal fraction of 6% and an average of 2.83% paternal alleles across the region, indicating that the fetus is unaffected.

