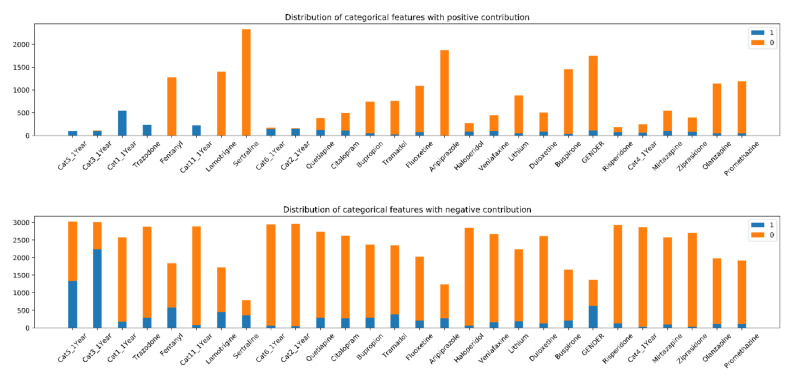
Figure 5.
Distribution of feature values with positive and negative contributions. Most 0 values are associated with a higher risk of suicide and 1 are considered having lower risks. 0 means that the patients did not have the disease or did not take the medication and 1 means they did. Some features showed obvious separation in contributions by values which means the values of these features are strongly associated with the final prediction( CatN_1Year: Disease Category N in last year (N = 1, 2, 3, 4, 5, 6 and 11)).

