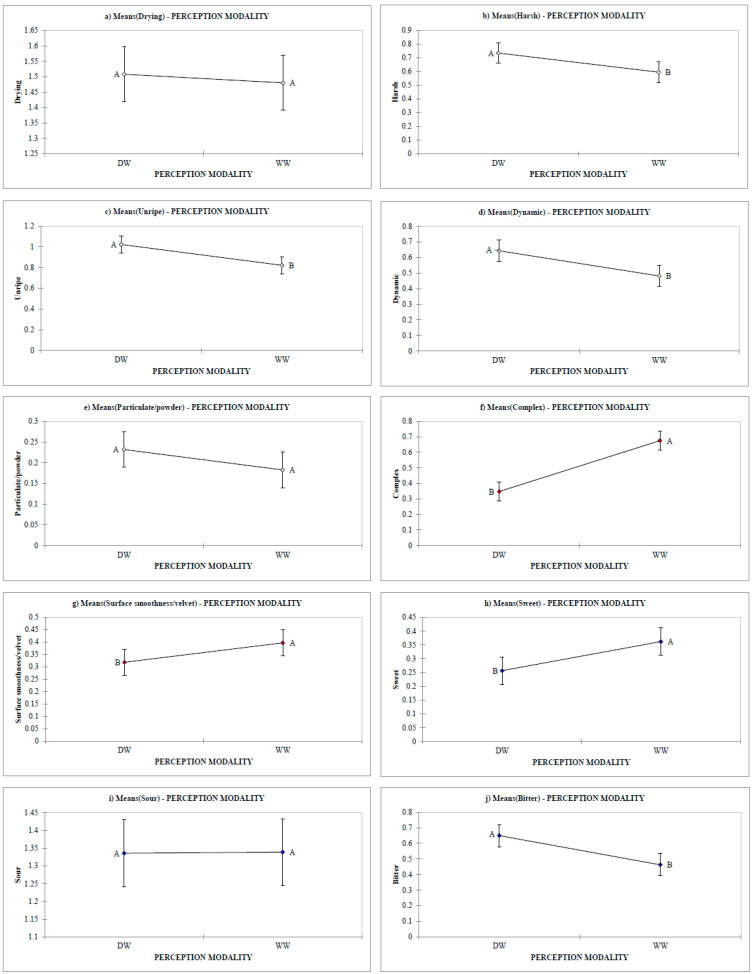
Figure 3.
Variation of mean intensities (over 74 wines) of each astringency sub-quality and taste sensation during DWs tasting compared to corresponding WW: (a) Drying, (b) Harsh, (c) Unripe, (d) Dynamic, (e) Particulate/powder, (f) Complex, (g) Surface smoothness/Velvet, (h) Sweet, (i) Sour and (j) Bitter. Significant differences are marked with different letters (p < 0.05). whole wines (WWs), deodorized wines (DWs).

