Figure 4.
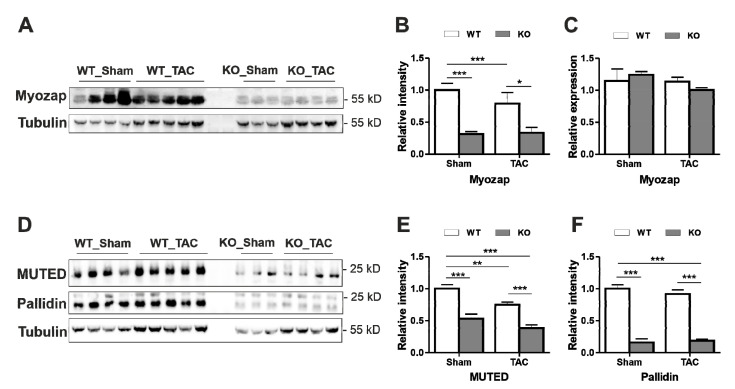
Myozap and BLOC-1 complex are dysregulated after knock-out of Dysbindin. (A) Immunoblots depicting Myozap protein levels in Sham/TAC operated mice, its densitometric analysis against Tubulin shown in (B) and transcript levels in (C). (D) Immunoblots depicting the protein levels of BLOC-1 components Muted and Pallidin along with their densitometric analysis against Tubulin shown in (E) and (F), respectively. Statistical significance was calculated by two-way ANOVA. Error bars show mean ± S.E. *, p < 0.05; **, p < 0.01; ***, p < 0.001.

