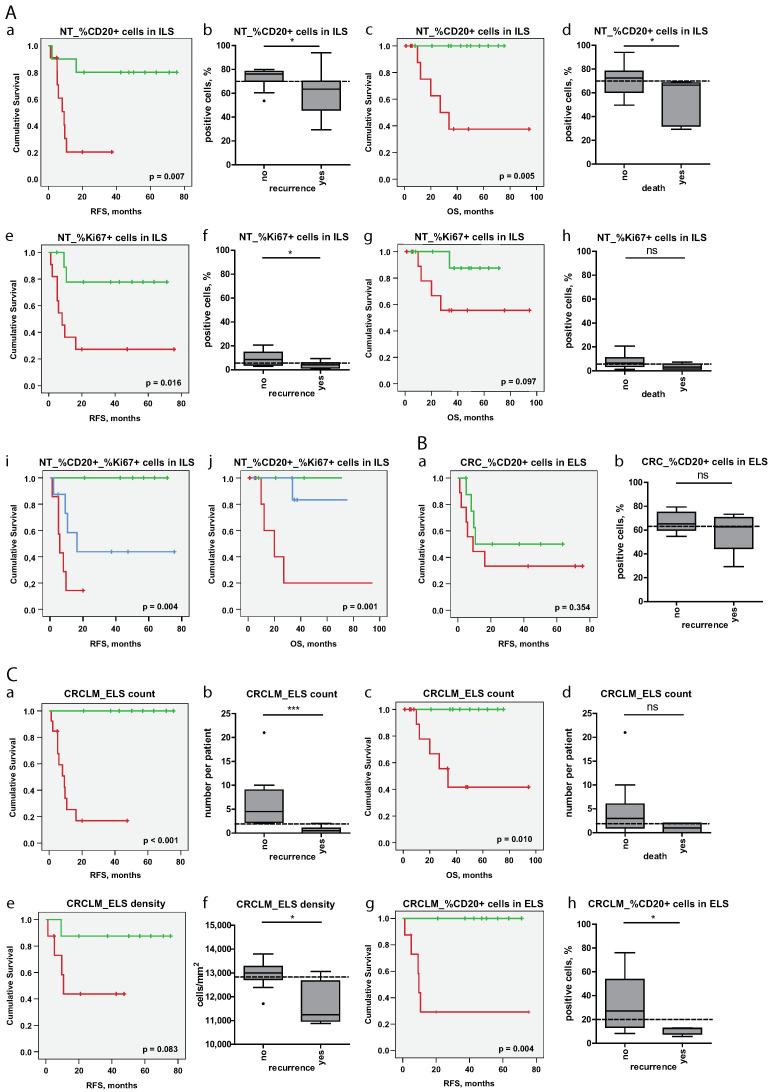
Figure 8.
Patient stratification strategies on the basis of staining-derived data sets. Shown are Kaplan-Meier estimates for patient stratification in terms of survival based on staining-derived variables attributed to NT ((A), a, c, e, g, i, and j), CRC ((B), a), and CRCLM ((C), a, c, e, and g) tissue entities. RFS and OS were shown by Kaplan-Meier graphs, stratified by the median of the corresponding variable (Table S2) into low- and high-risk groups (higher than median indicates lowrisk); p-value of the log-rank test is indicated. Additionally, the combined variable “NT_% CD20+_% Ki67+ cells in ILS” was used for patient stratification into low-risk group (classified as low/low risk based on the variables “NT_% CD20+ cells in ILS” and “NT_% Ki67+ cells in ILS”), intermediate-risk group (classified as low risk based on the first variable and as high risk based on the second variable and vice versa), and high-risk group (classified as high/high risk based on the variables “NT_% CD20+ cells in ILS” and “NT_% Ki67+ cells in ILS”). Furthermore, the boxplots ((A), b, d, f, and h for NT; (B), b for CRC; C, b, d, f, and h for CRCLM) illustrate the sub-division of patients without event (disease recurrence in case of RFS and death in case of OS) and patients with event, named as “no” and “yes”, respectively. This was used as an additional exploratory representation of data; the group membership may change over time. Herein, the median value, which was used for patient stratification on the corresponding Kaplan-Meier plots, is indicated by the dashed line. Mann-Whitney-U test was used for group comparison. Significant results are indicated by asterisks: * (p < 0.05) and *** (p < 0.001); ns, not significant. RFS, recurrence free survival; OS, overall survival; NT, non-tumorous tissue; CRC, colorectal cancer; CRCLM, colorectal cancer liver metastasis; ILS, isolated lymphoid structure; ELS, ectopic lymphoid structure.

