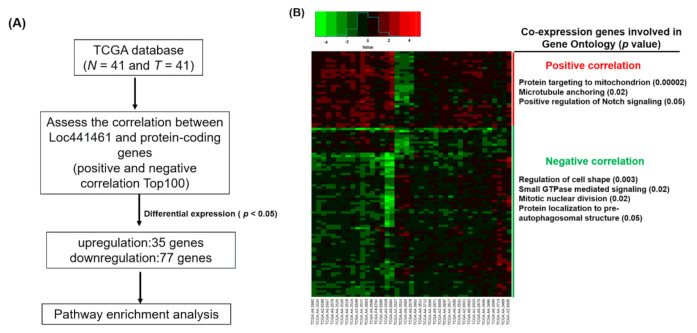
Figure 2.
Identification of LOC441461-coexpressed genes through the TCGA database and pathway enrichment analysis. (A) Flowchart of identification of genes coexpressed with LOC441461 with significant differential expression (p < 0.05), as identified in CRC in the TCGA database. (B) Heat map of genes with significant expression (p < 0.05) in 41 CRC N-T pairs from TCGA database (left panel). The positively and negatively correlation genes were subjected to gene ontology analysis, and significantly involved pathways are displayed in the right panel.

